Version information
This page displays graphs from the OSI SAF Sea Ice Index v2p2: the sea-ice extent time-series plots on this page are all based on our Sea Ice Concentration v3 (climate and near-real-time) data.
To learn more about this product, see:
- The dedicated product page in our catalogue: https://osi-saf.eumetsat.int/products/osi-420
- The Documentation section at the bottom of this page.
Daily updated Sea Ice Extent
| Northern Hemisphere | Southern Hemisphere |
|---|---|
|
|
|
|
|
|
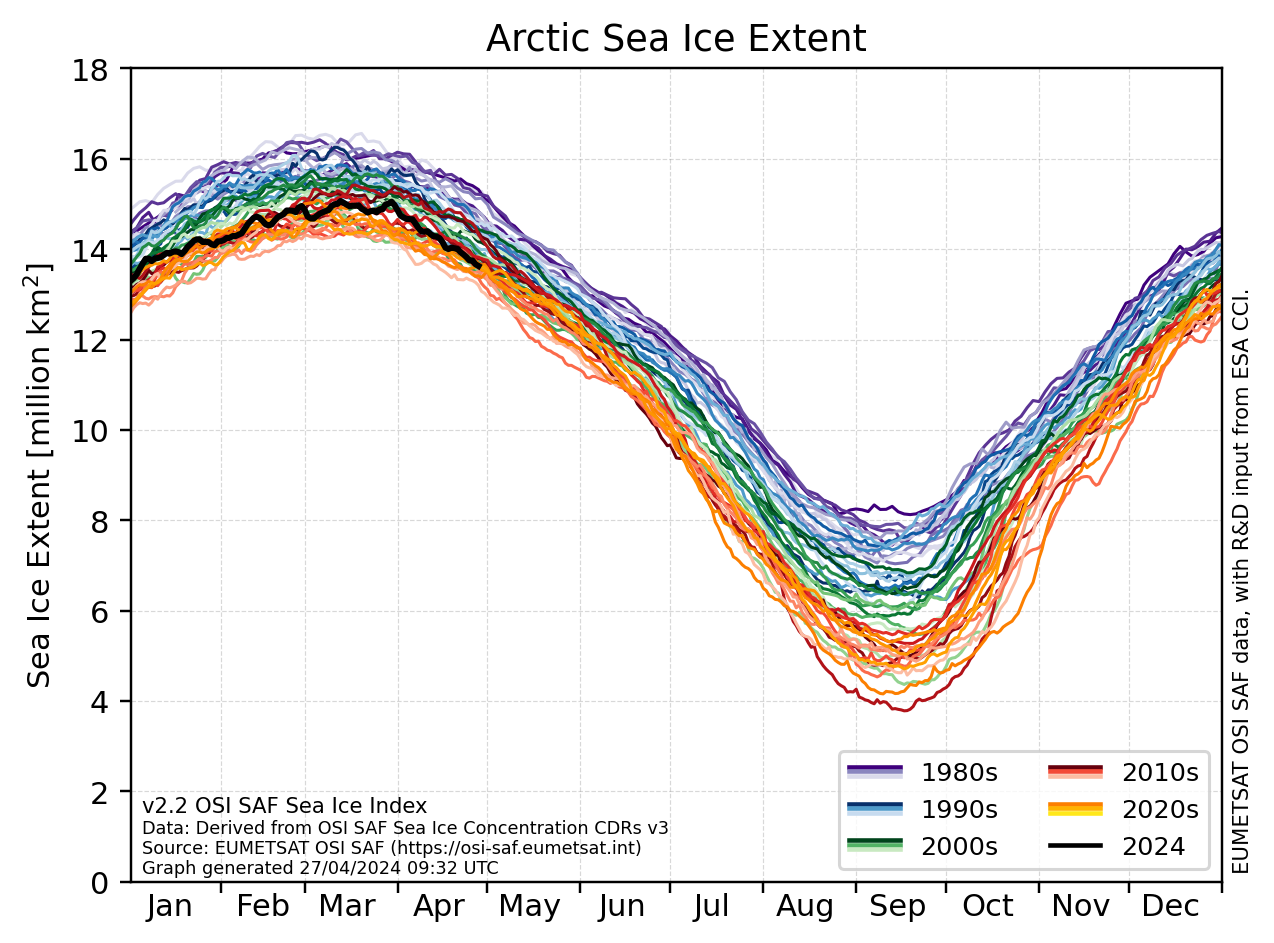
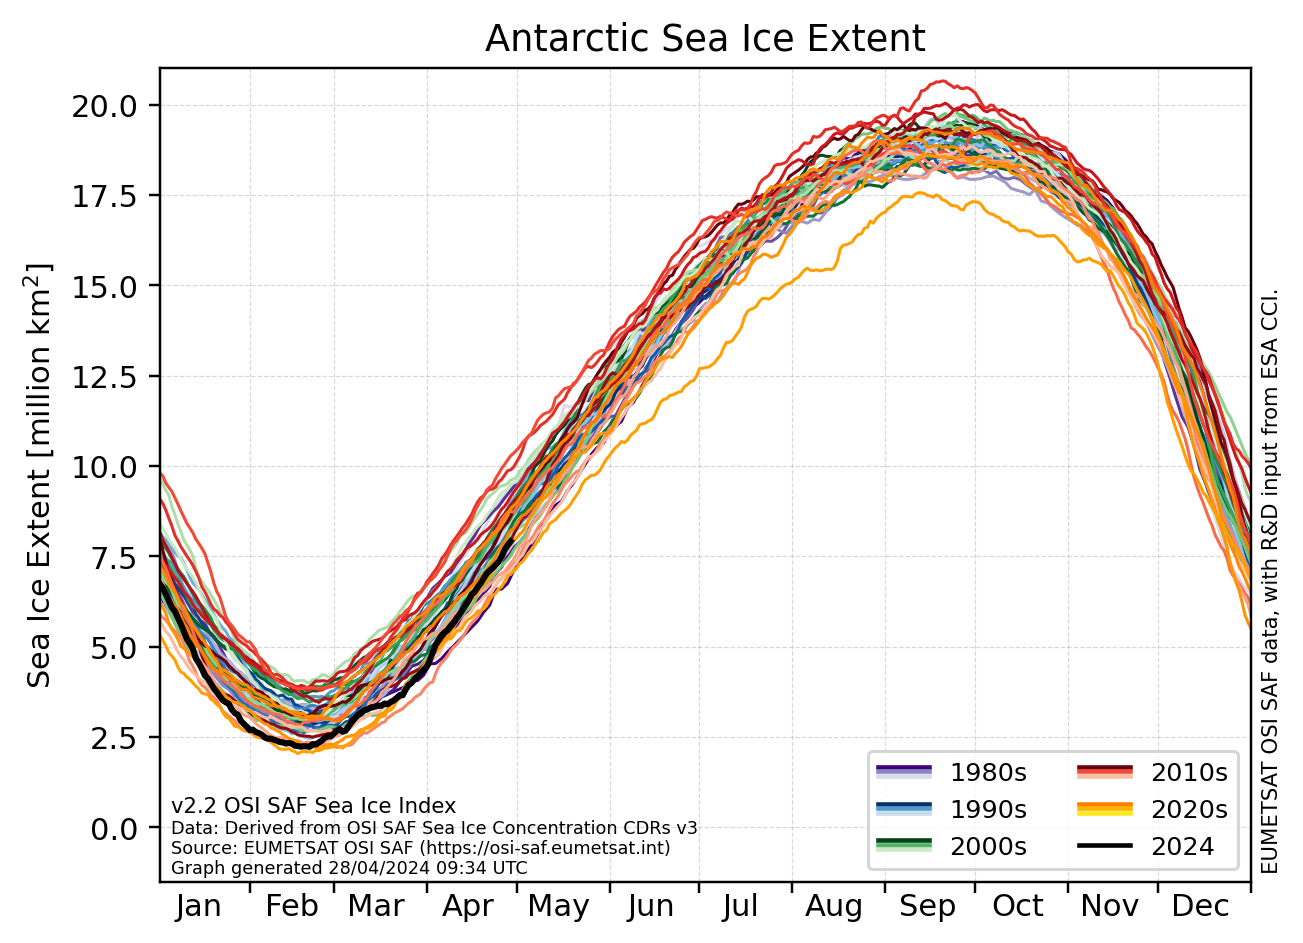
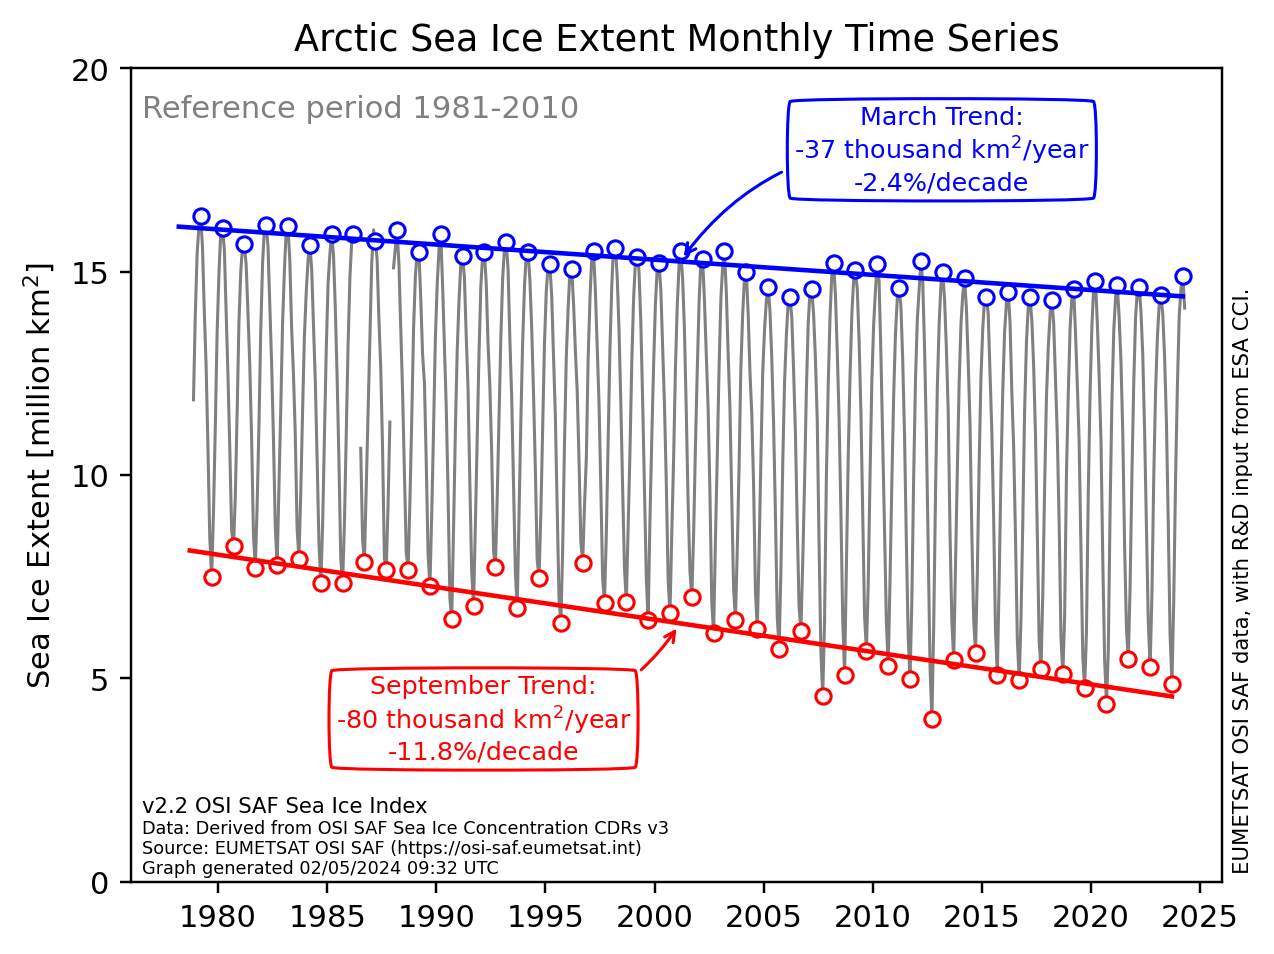
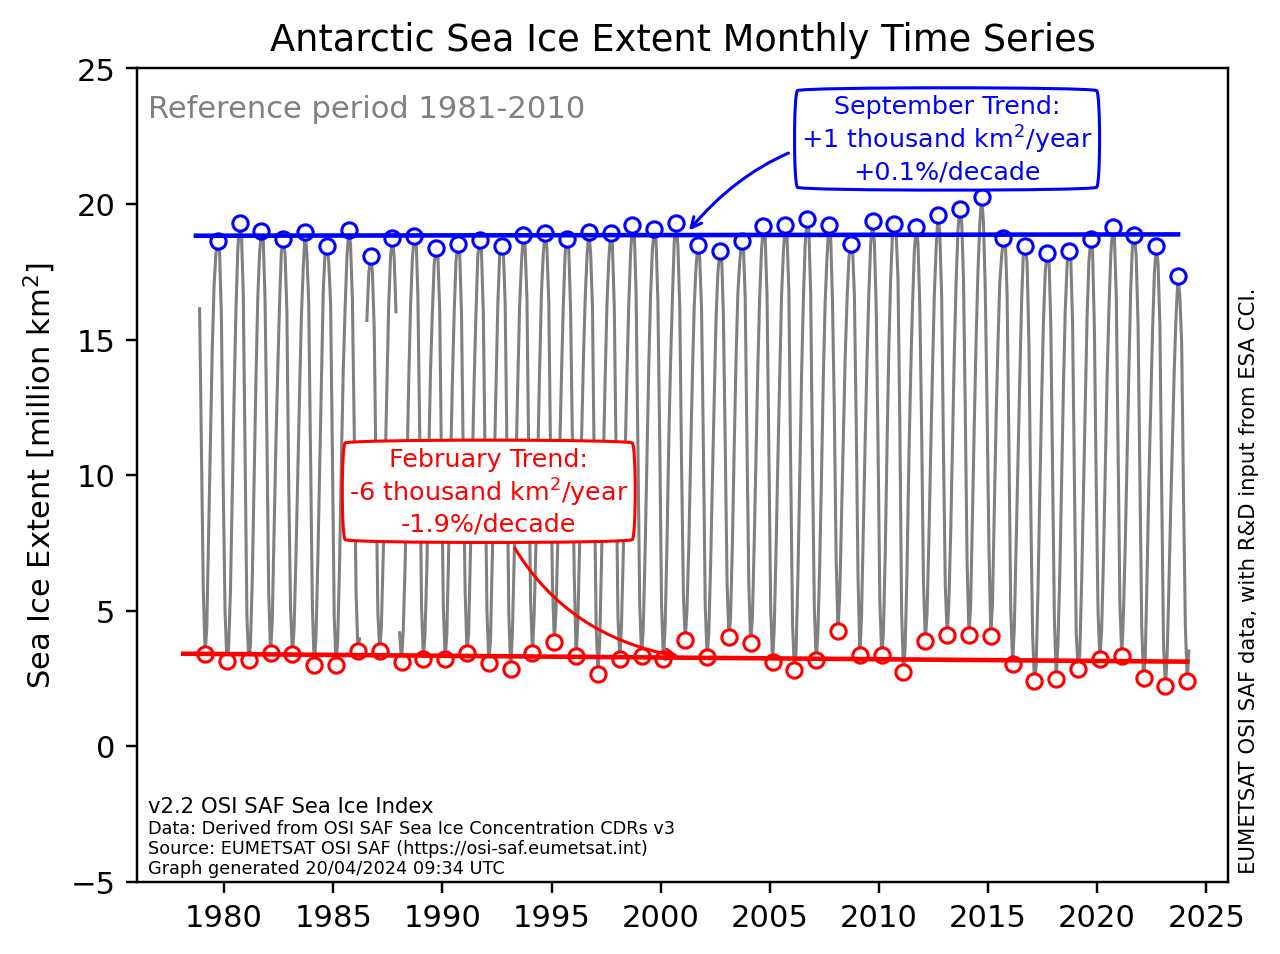
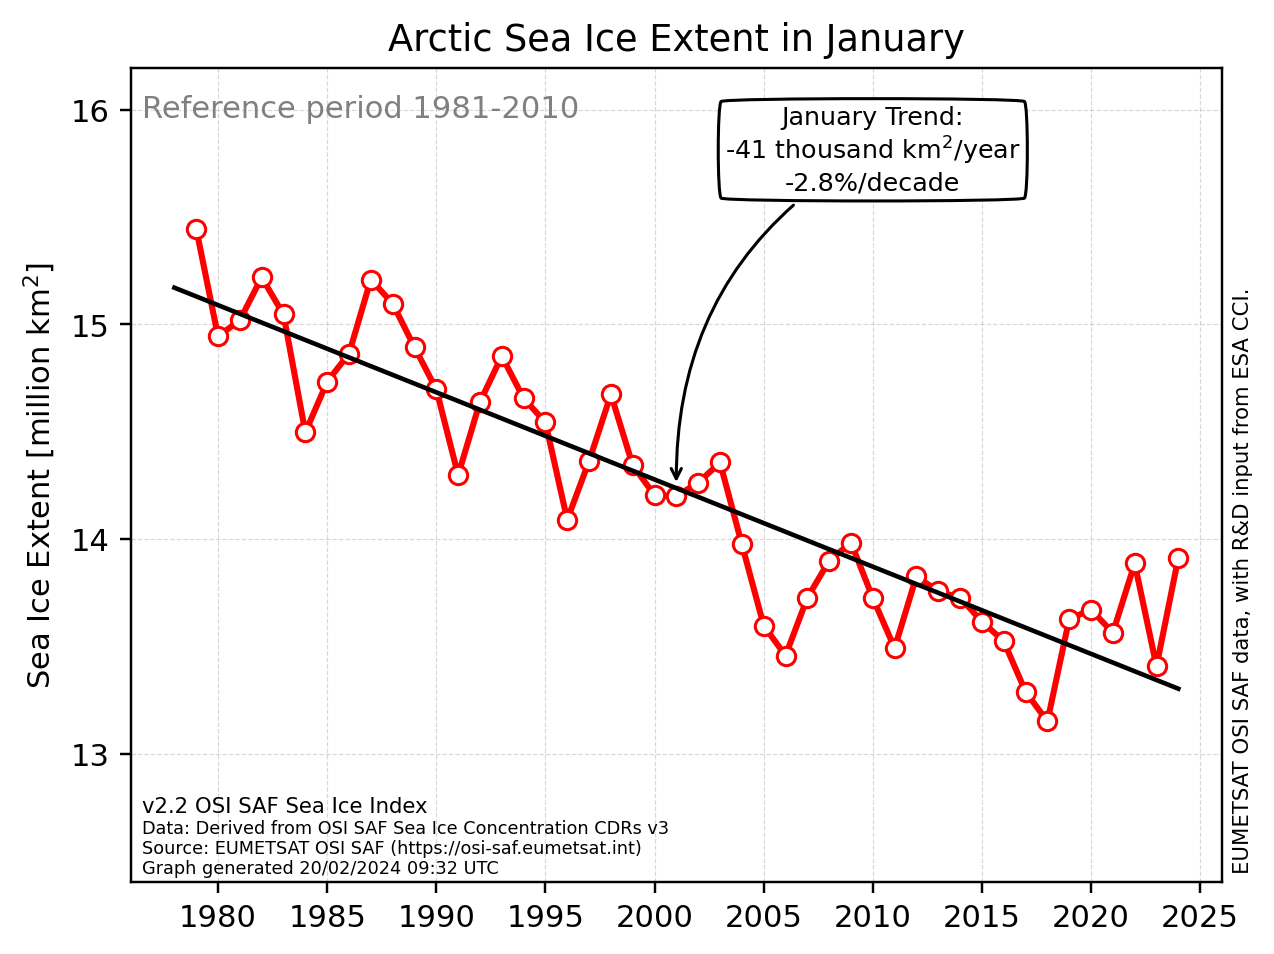
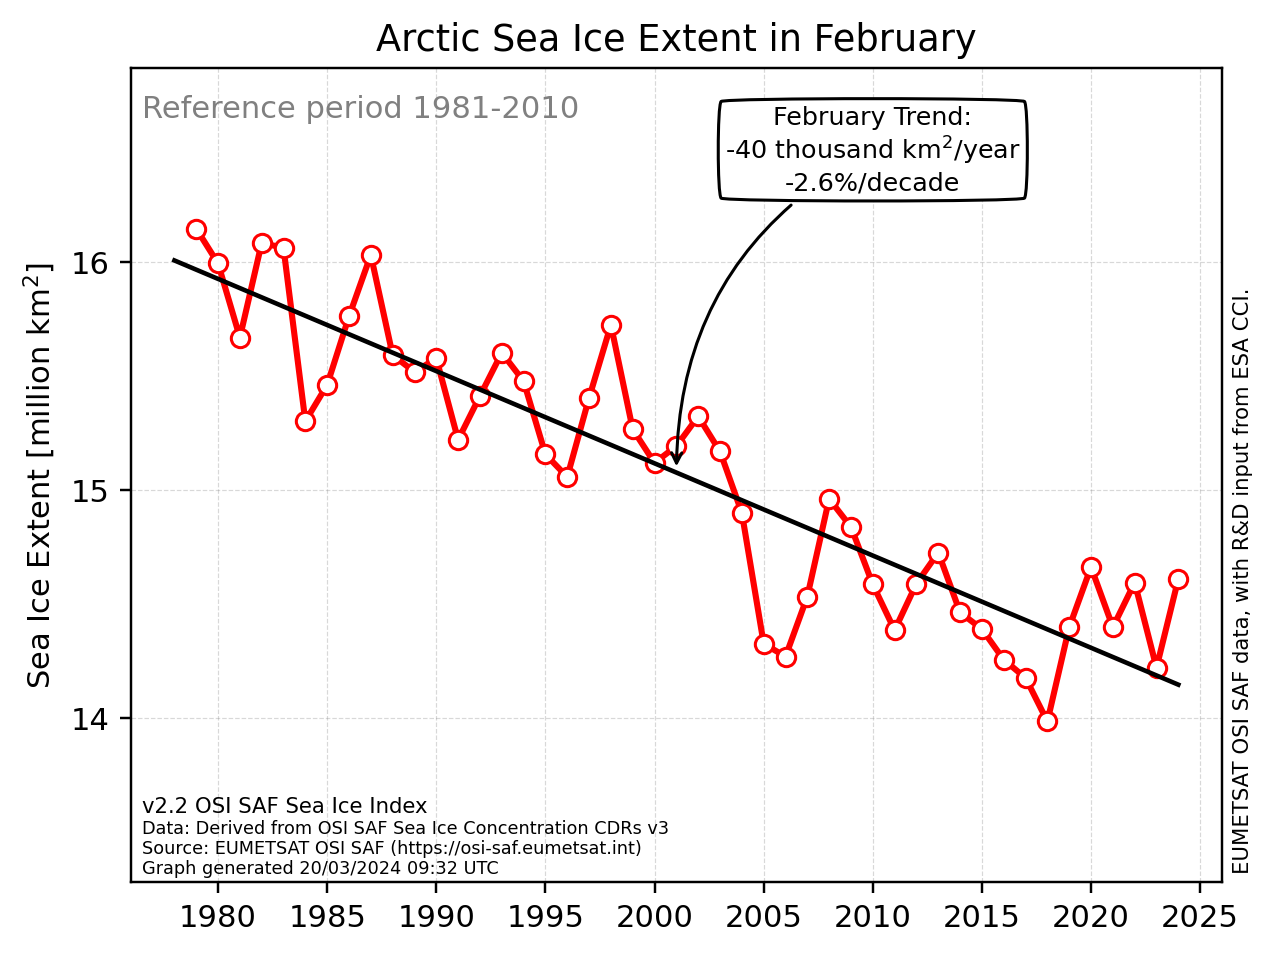
All months since 1979
| Northern Hemisphere | Southern Hemisphere |
|---|---|
|
|
|
Trend for last month
| Northern Hemisphere | Southern Hemisphere |
|---|---|
|
|
|

Trend for current month
| Northern Hemisphere | Southern Hemisphere |
|---|---|
|
|
|
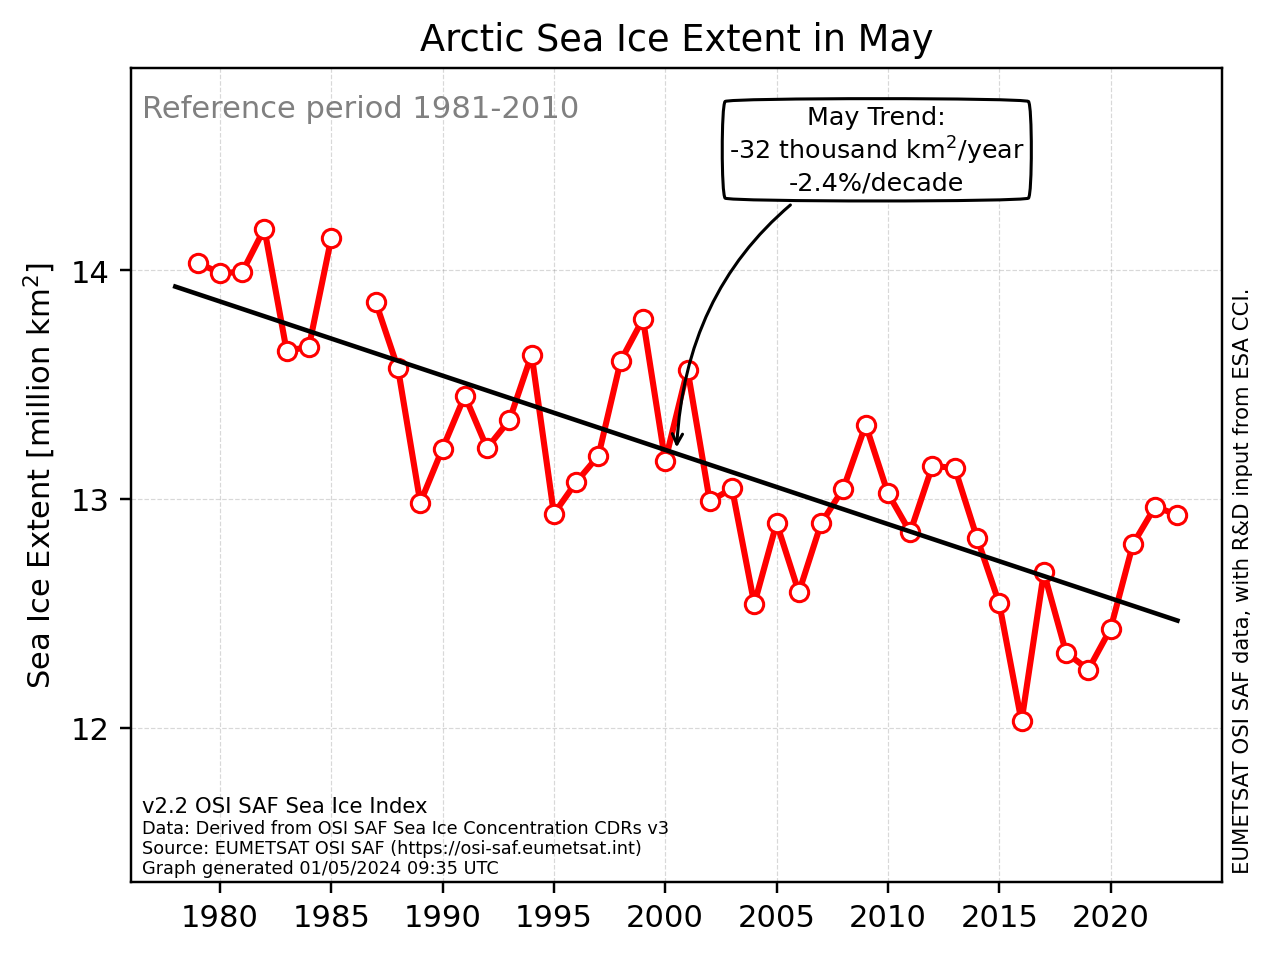

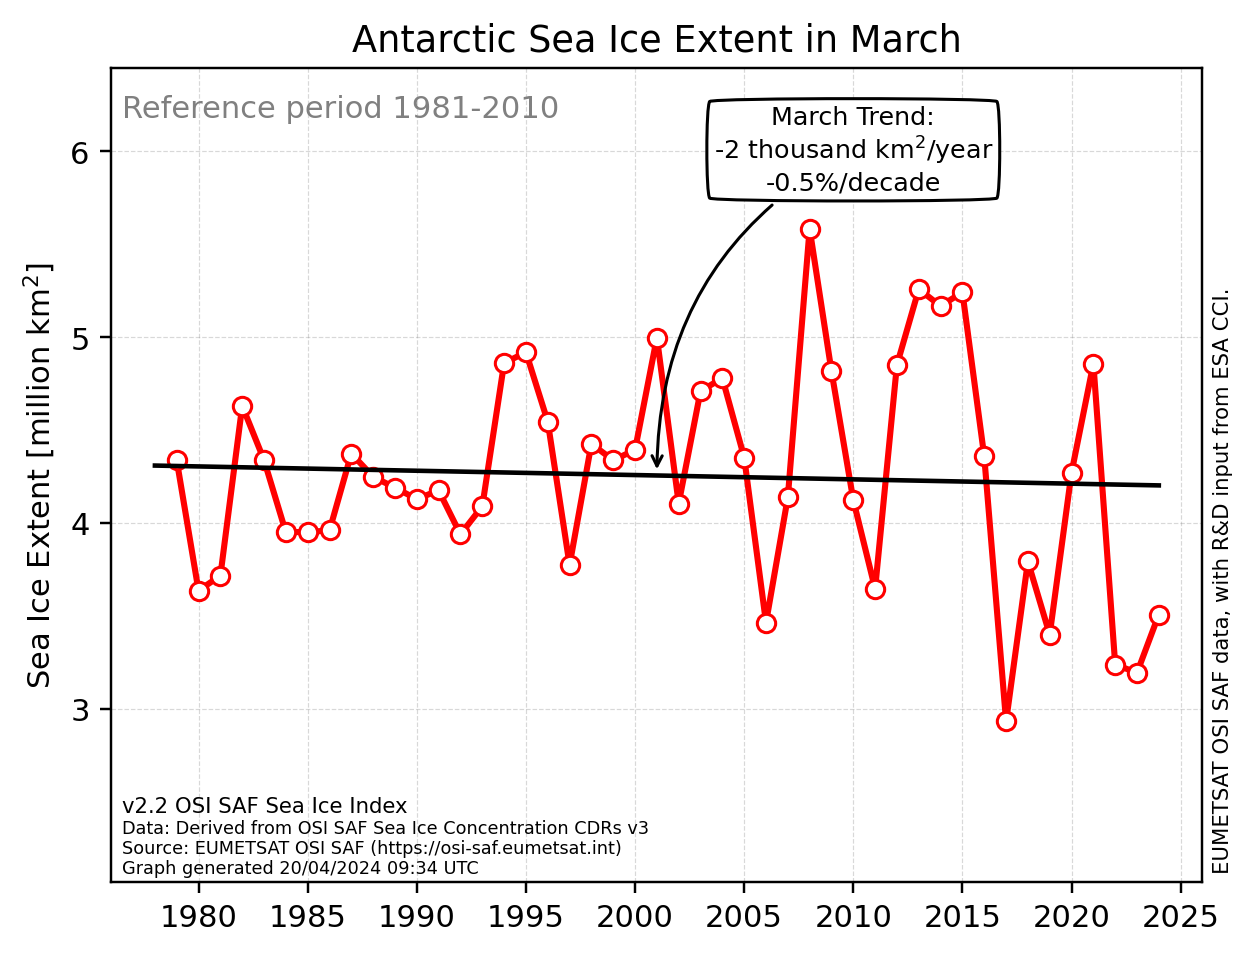
All months
| Northern Hemisphere | Jan | Feb | Mar | Apr | May | Jun | Jul | Aug | Sep | Oct | Nov | Dec |
|---|---|---|---|---|---|---|---|---|---|---|---|---|
| Southern Hemisphere | Jan | Feb | Mar | Apr | May | Jun | Jul | Aug | Sep | Oct | Nov | Dec |
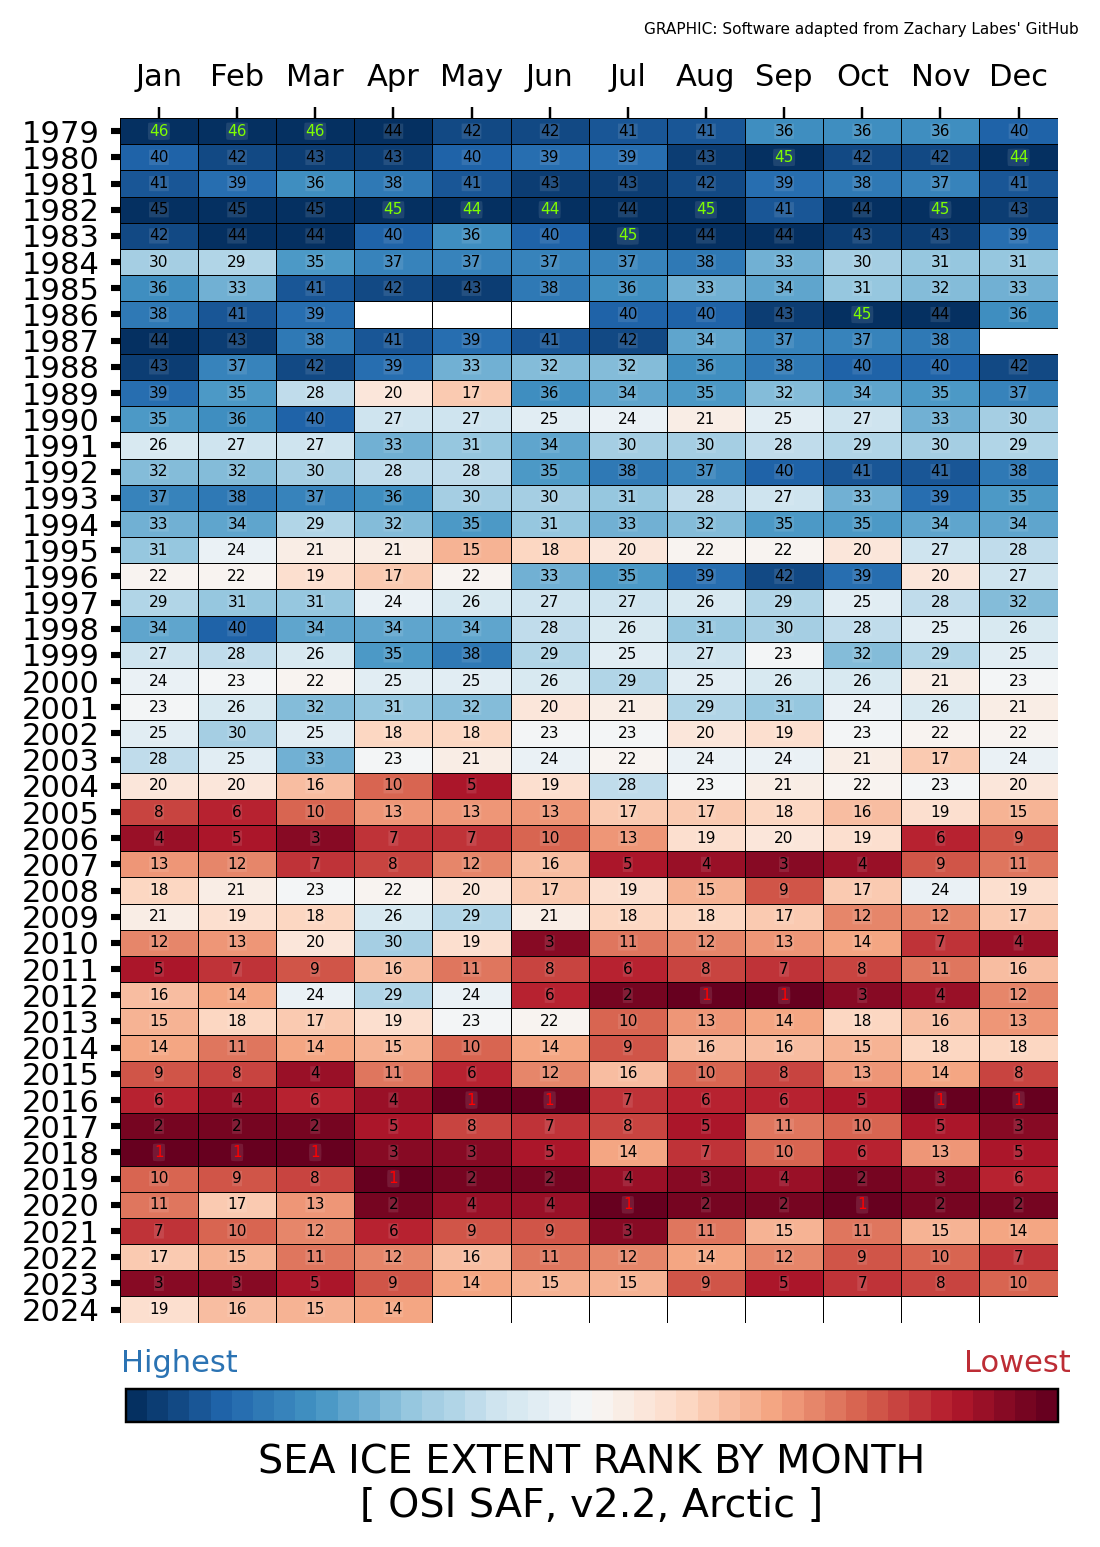
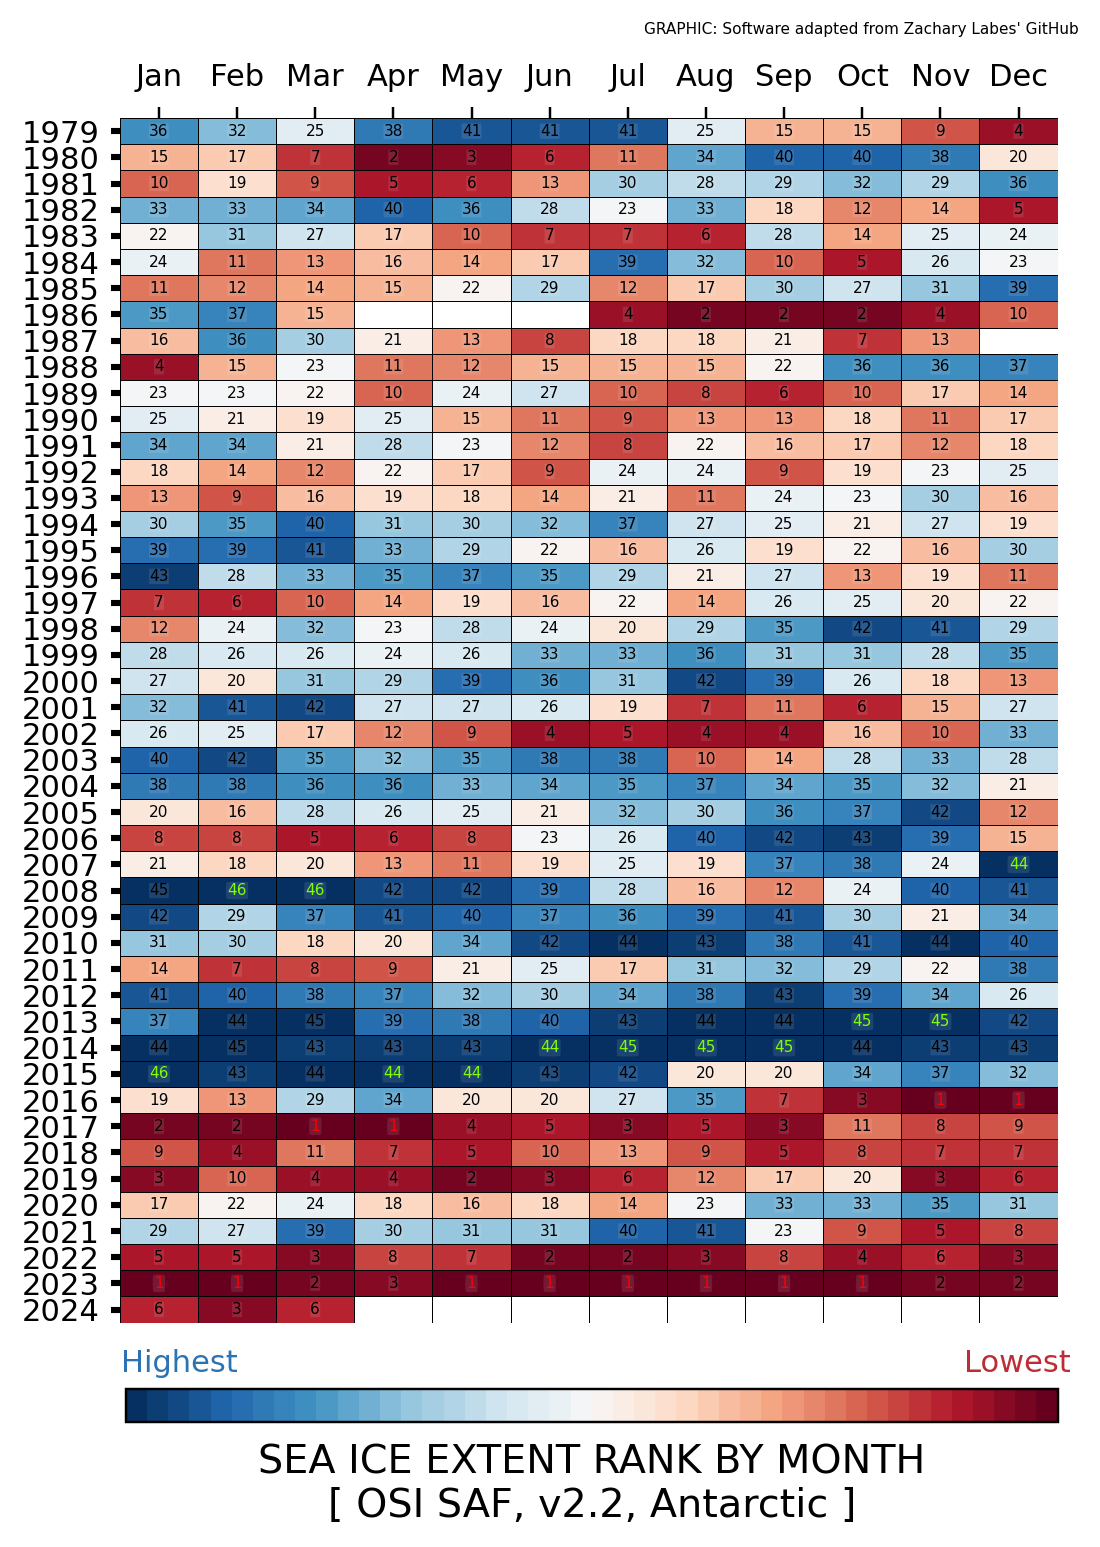
Rank of monthly sea ice extent
| Northern Hemisphere | Southern Hemisphere |
|---|---|
|
|
|
Data
Sea ice extent data are available from the table below.
| Daily values | Monthly values | |
|---|---|---|
| Northern Hemisphere | nc | nc |
| Southern Hemisphere | nc | nc |
| Global | nc | nc |
| Svalbard | nc | nc |
| Barents Sea | nc | nc |
| Beaufort Sea | nc | nc |
| Chukchi Sea | nc | nc |
| East Siberian Sea | nc | nc |
| Fram Strait/Greenland Sea | nc | nc |
| Kara Sea | nc | nc |
| Laptev Sea | nc | nc |
| Amundsen-Bellingshausen Sea | nc | nc |
| Indian Sea | nc | nc |
| Ross Sea | nc | nc |
| Weddell Sea | nc | nc |
| Western Pacific Ocean | nc | nc |
All available data files, including both sea-ice extent and area, can be accessed from the OSI SAF ftp server: ftp://osisaf.met.no/prod_test/ice/index/v2p2/.
Documentation
A Product User Manual is available here. Some relevant information are extracted below, refer to the PUM for more details.
Citing use of the data
See suggestions how to cite at the bottom of https://osi-saf.eumetsat.int/products/osi-420
Definitions
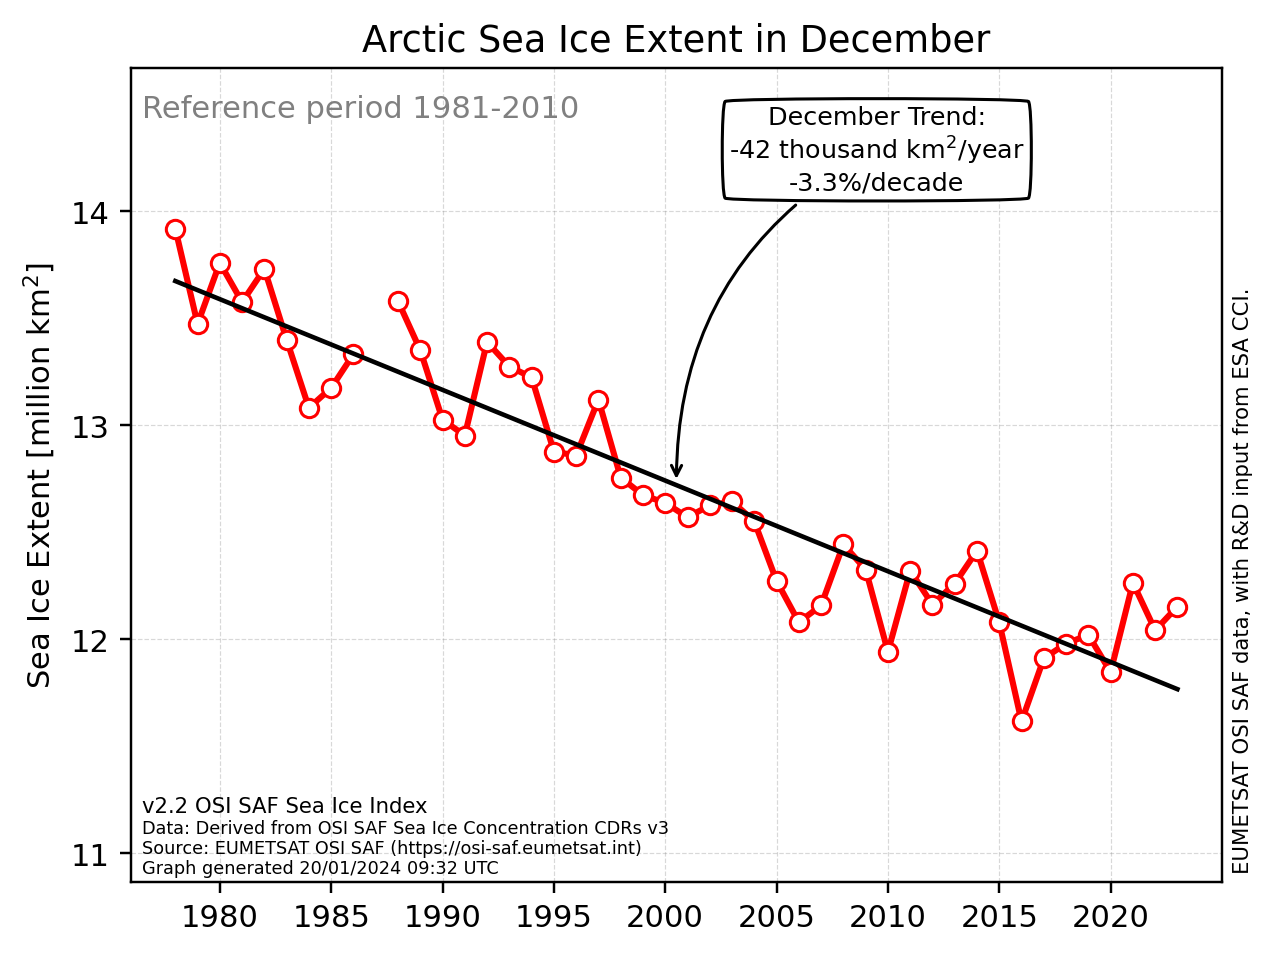
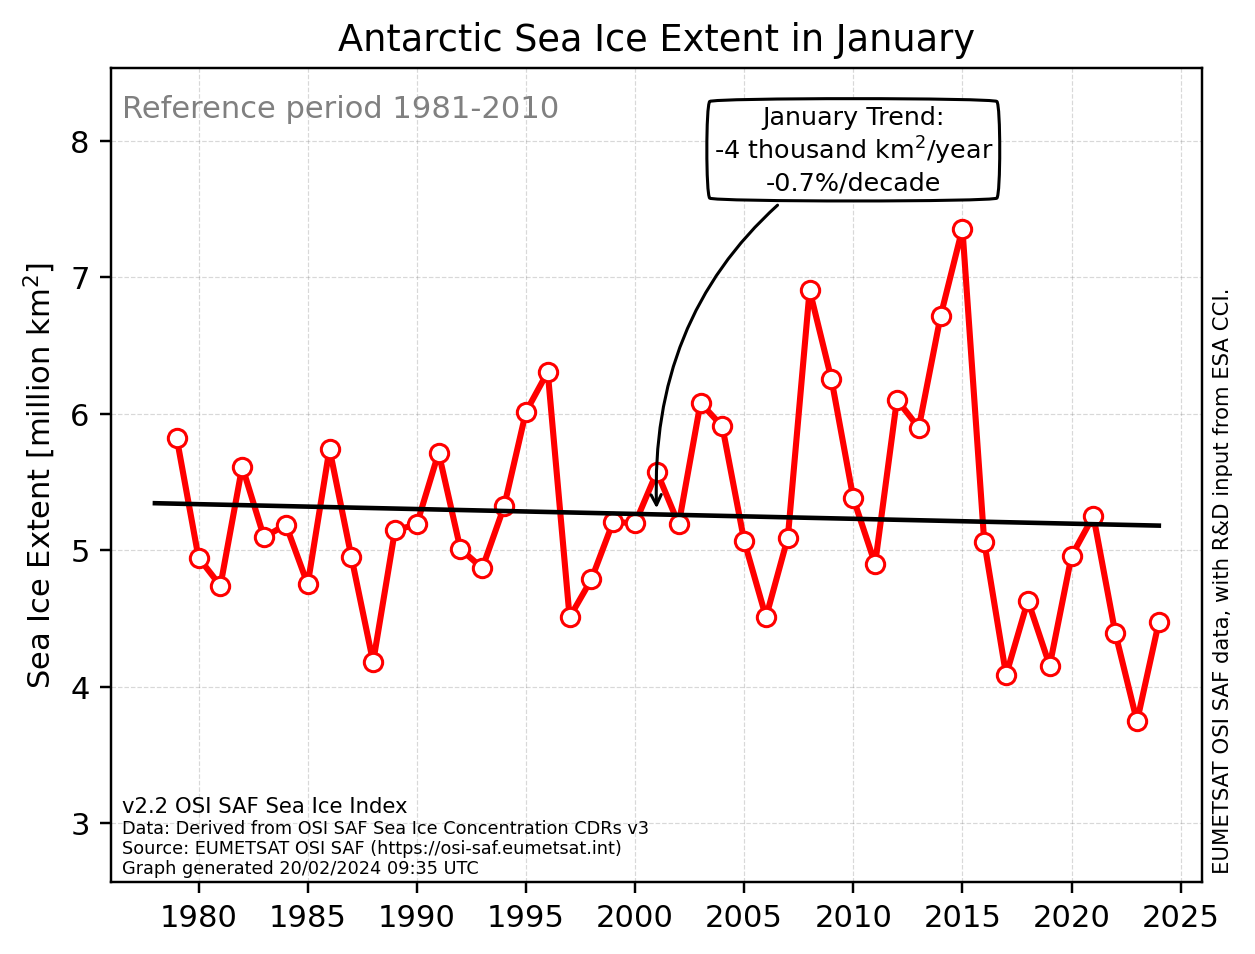
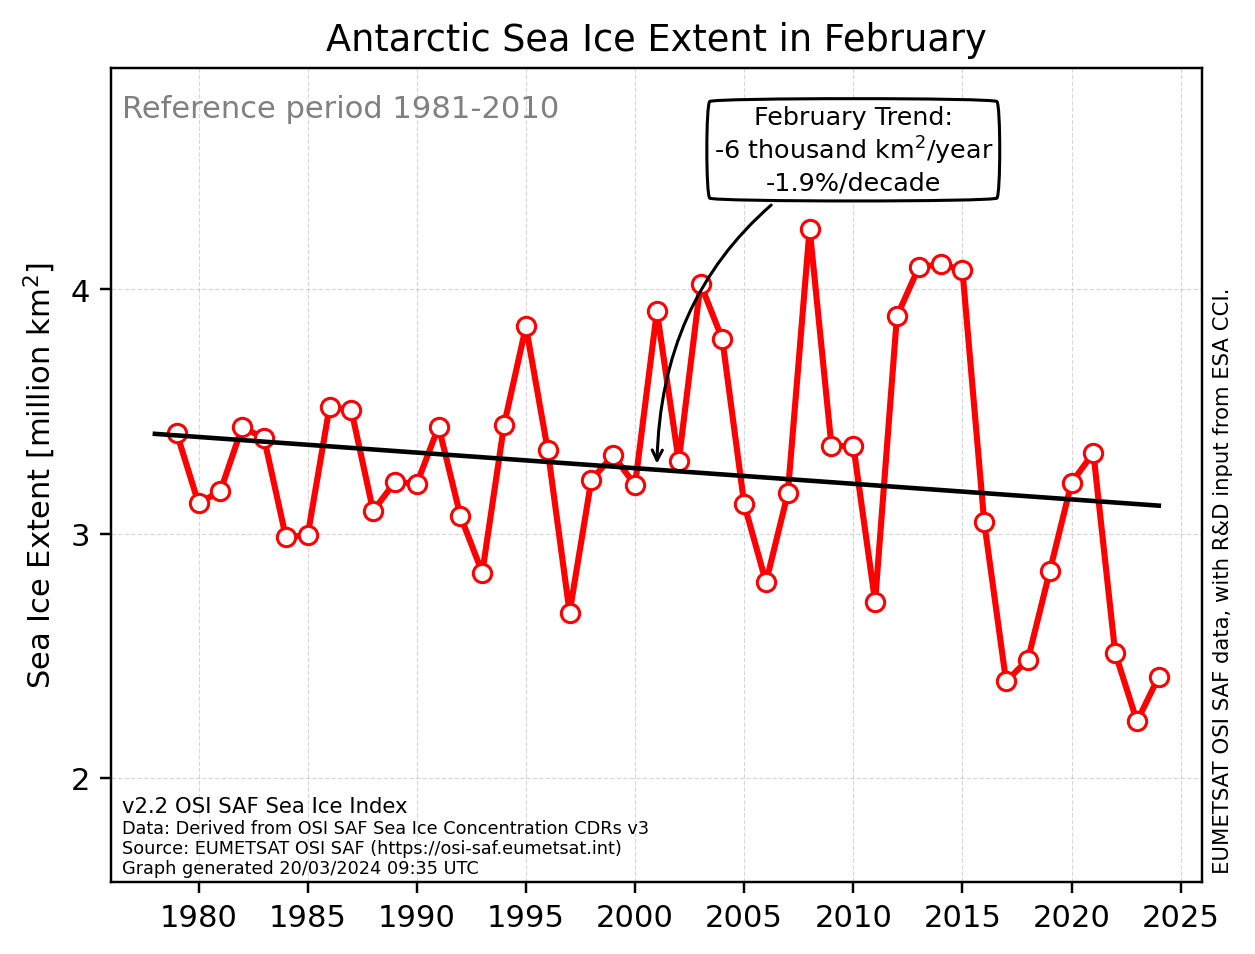
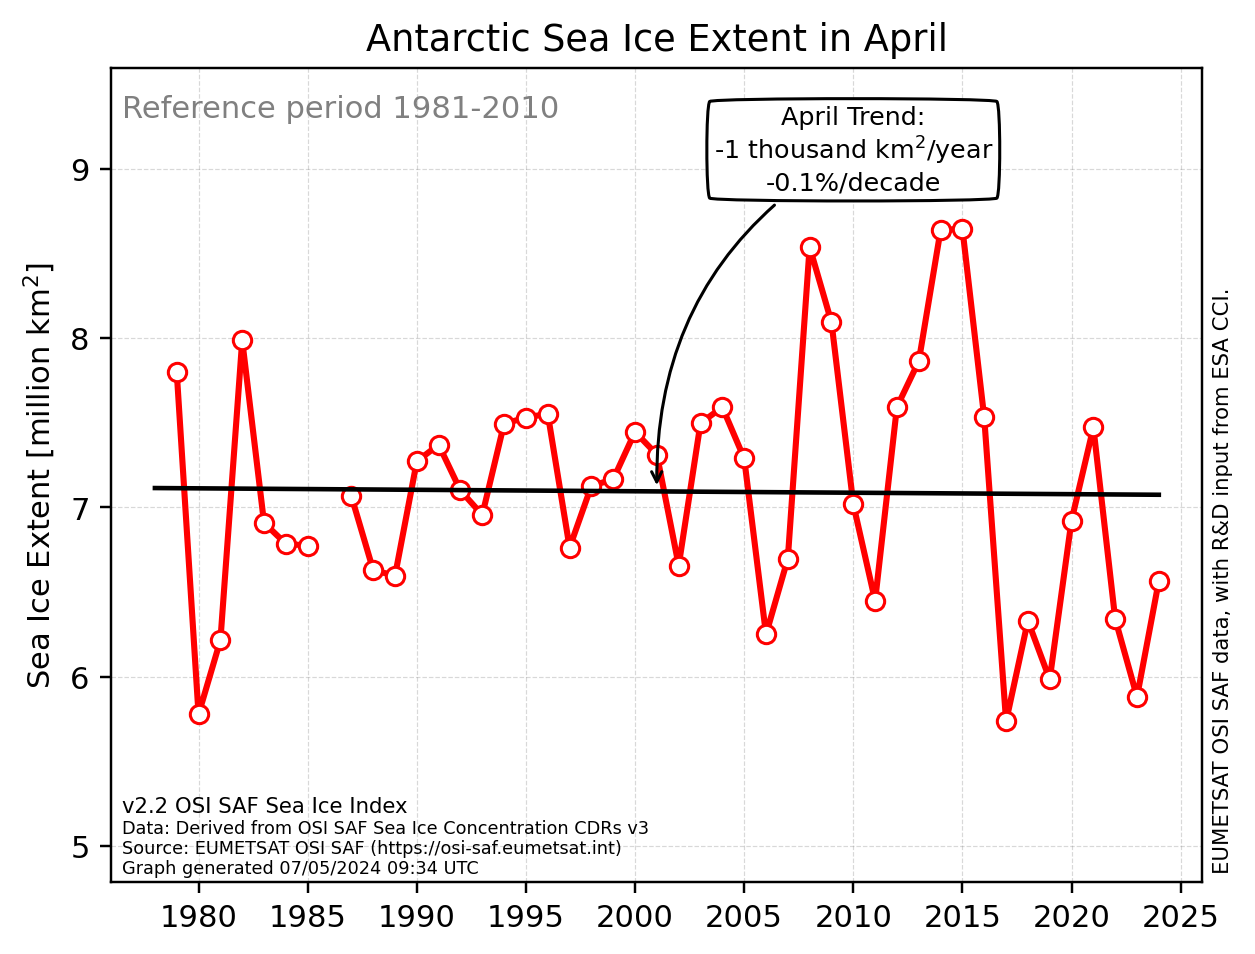
Sea Ice Extent (SIE) is defined as the area covered by a significant amount of sea ice, that is the area of ocean covered with more than 15% Sea Ice Concentration (SIC).
Sea Ice Area (SIA) is the total ocean area covered by any amount of ice (0% SIC threshold).
Sea Ice Concentration is the fractional coverage of a grid cell that is covered with sea ice.
At hemispherical scales, SIE is often reported with units of 10^6 sq km (millions square kilometers).
Input Data
The EUMETSAT OSISAF sea-ice extent and area are computed from three SIC products:
- The "v3" Climate Data Record (CDR), covering Oct 1978 to Dec 2020 (https://osi-saf.eumetsat.int/products/osi-450-a)
- The "v3" Interim Climate Data Record (ICDR), starting in Jan 2021, with a 16 days latency (https://osi-saf.eumetsat.int/products/osi-430-a);
- A Near-Real-Time (NRT) product that use the same processing chain as OSI-450-a and OSI-430-a, always up-to-date to the previous day.
The links above provide full documentation on the algorithms and processing details for these products, as well as URLS to access the SIC data, and to visualize examples maps of the products.
All our SIC products are based on passive microwave sensors. The CDR uses data from the SMMR, SSM/I, and SSMIS instruments, while the ICDR and NRT products are using SSMIS only.
Atmospheric fields of wind speed, water vapour and 2m temperature are used as well, all from the ECMWF, both from re-analysis (ERA-Interim), and operational forecasts.
Methodology
Daily values
Daily SIE values are computed from the daily SIC maps. All sea-ice covered ocean is included, lake ice is not. SIE is computed as the sum of the area of the grid cells that have a SIC value larger than 15%. SIA is the sum of the area of all grid cells that have a SIC value larger than 0%, weighted by the SIC value.
In the daily SIE and SIA time series, the CDR is always used from Oct 1978 to Dec 2020, then the ICDR from Jan 2021 onwards. The last 15 days of the time series are always from the NRT SIC product.
On days when SIC data are missing, SIE and SIA values are linearly interpolated from the neighbours. The interpolation is not conducted if more than 5 consecutive days are missing.
Monthly values
The OSISAF monthly SIE and SIA values are computed as averages of the daily SIE values, also using the interpolated daily values.
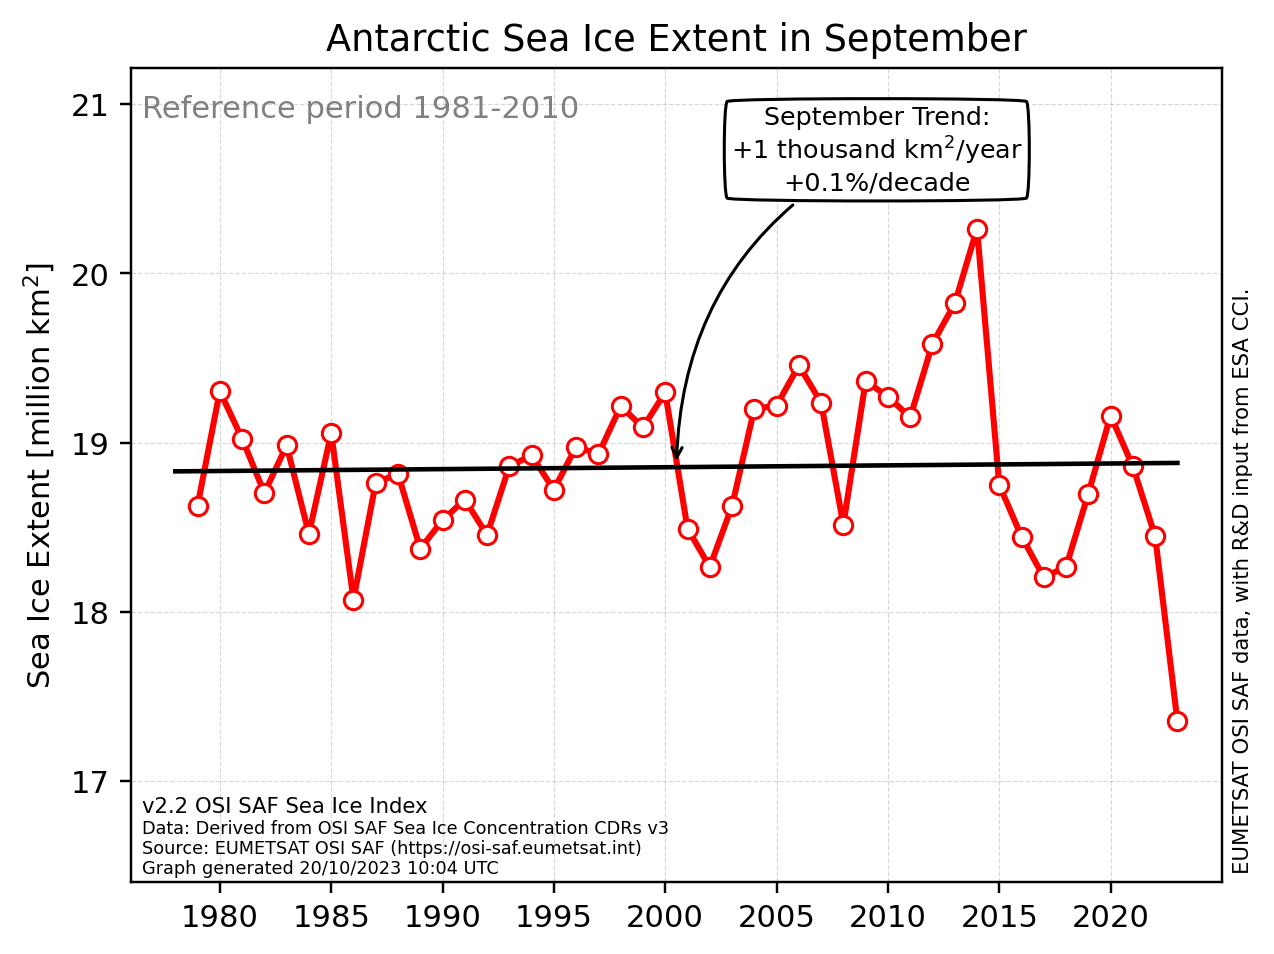
Trends and reference period
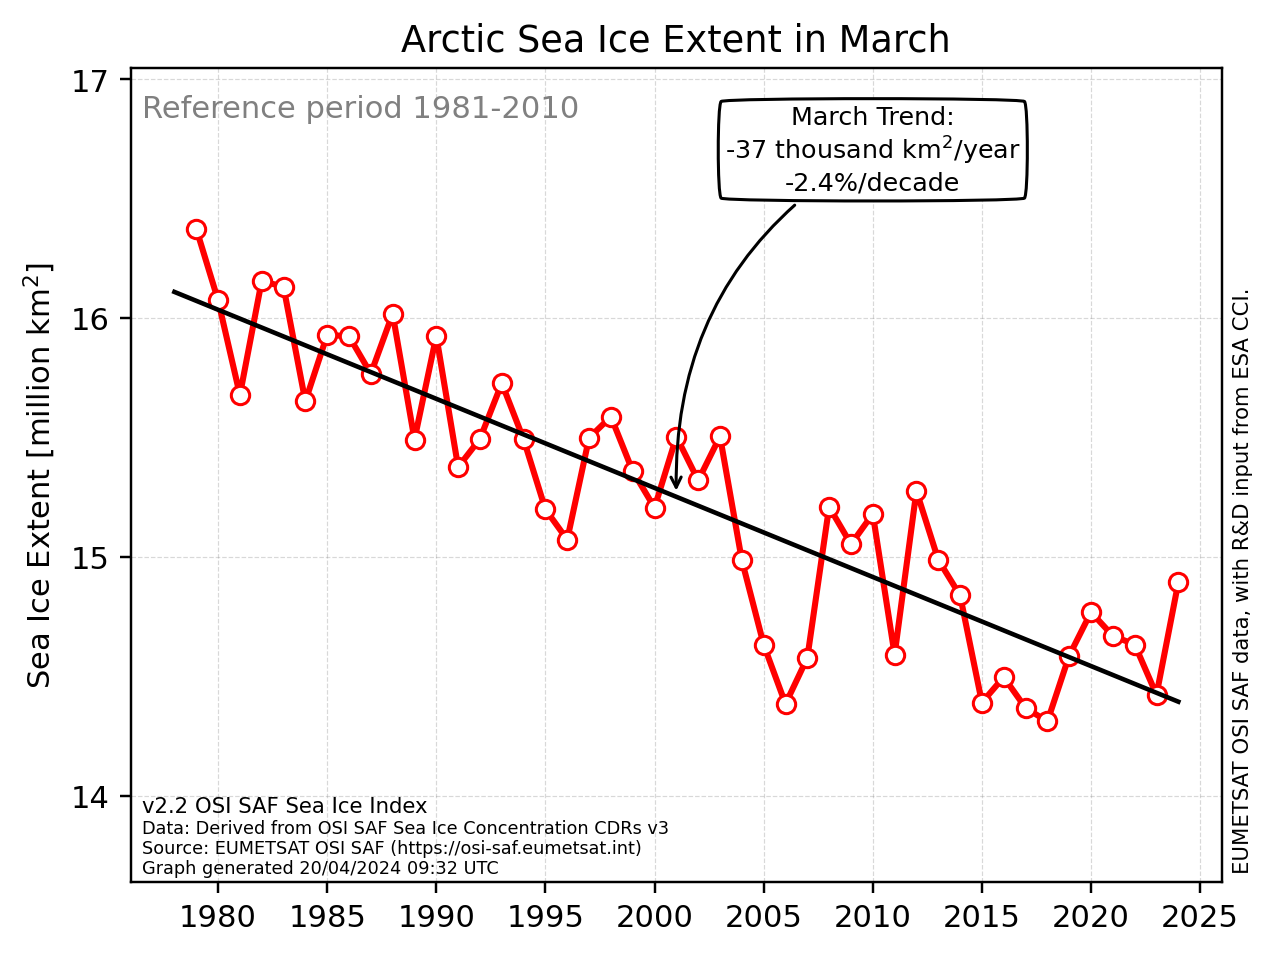
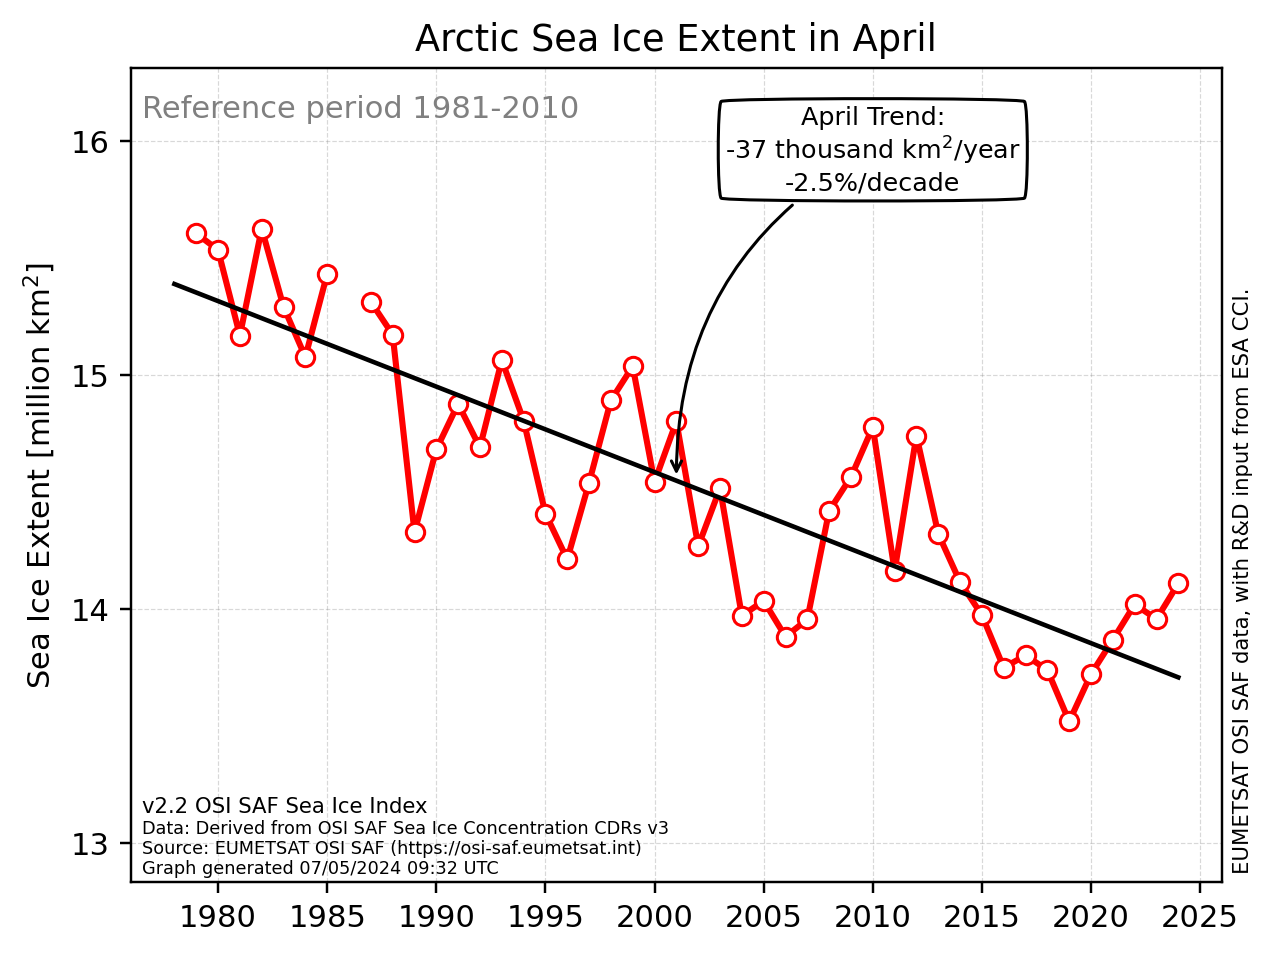
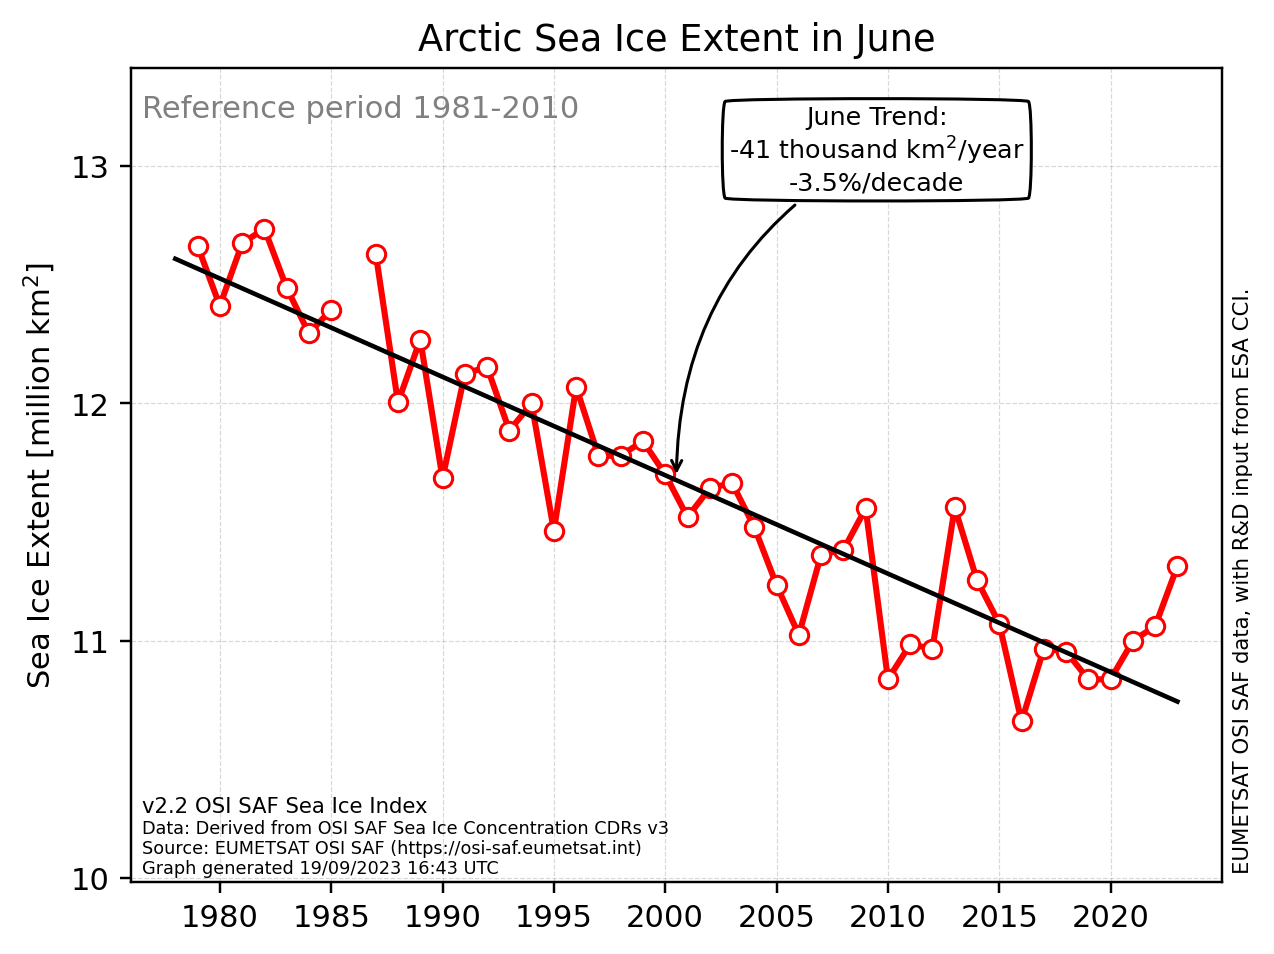
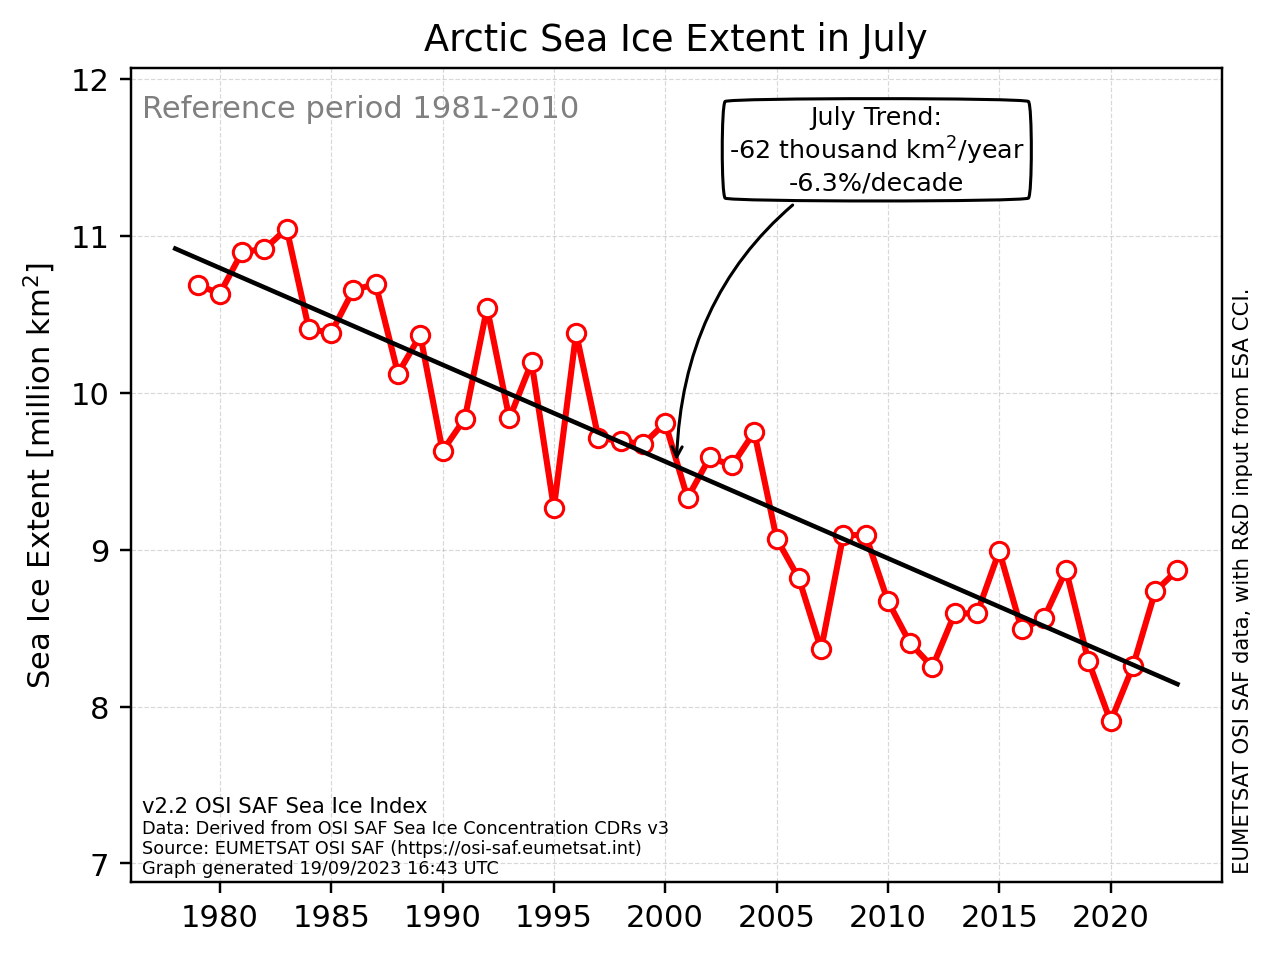
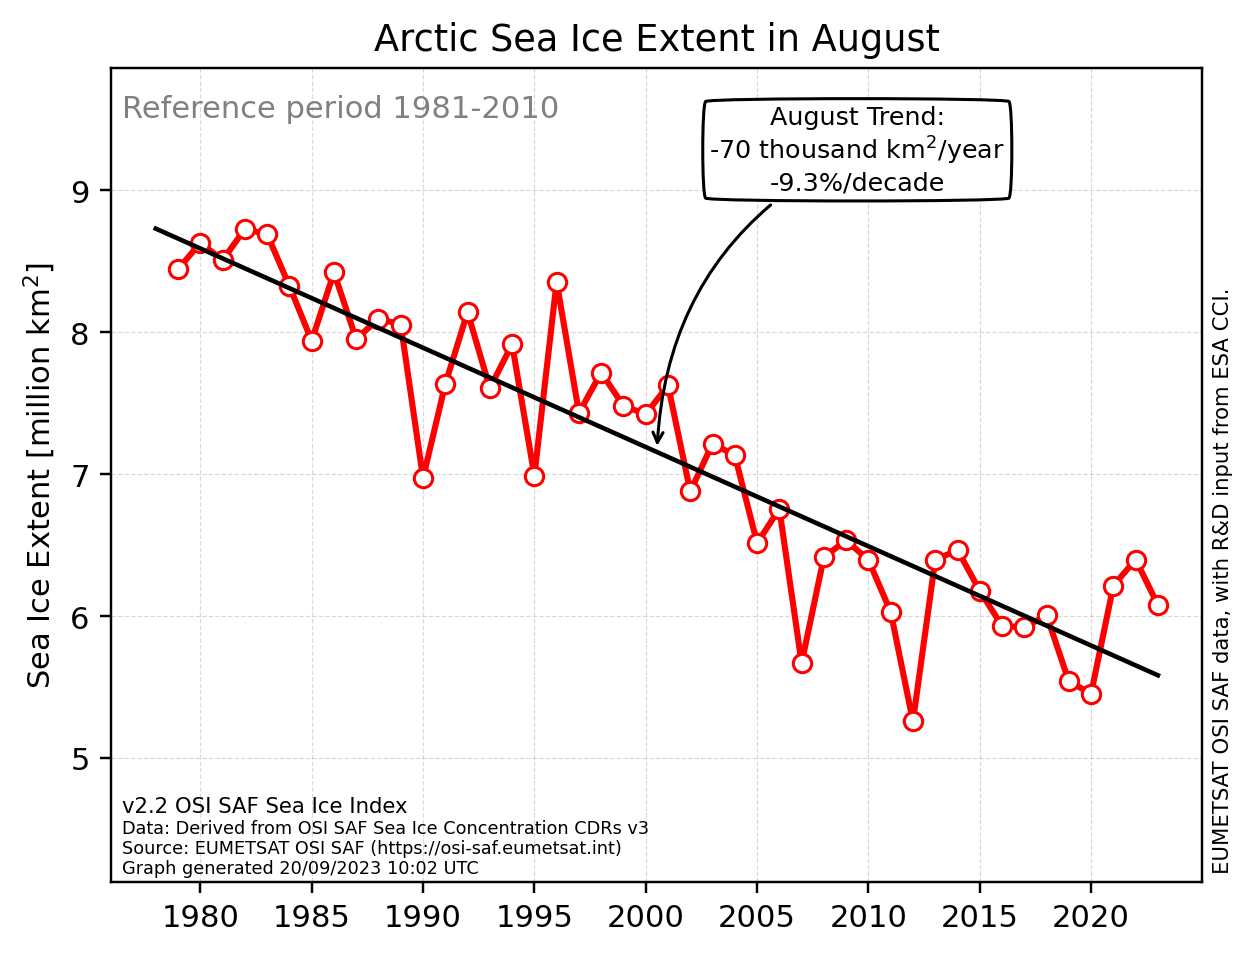
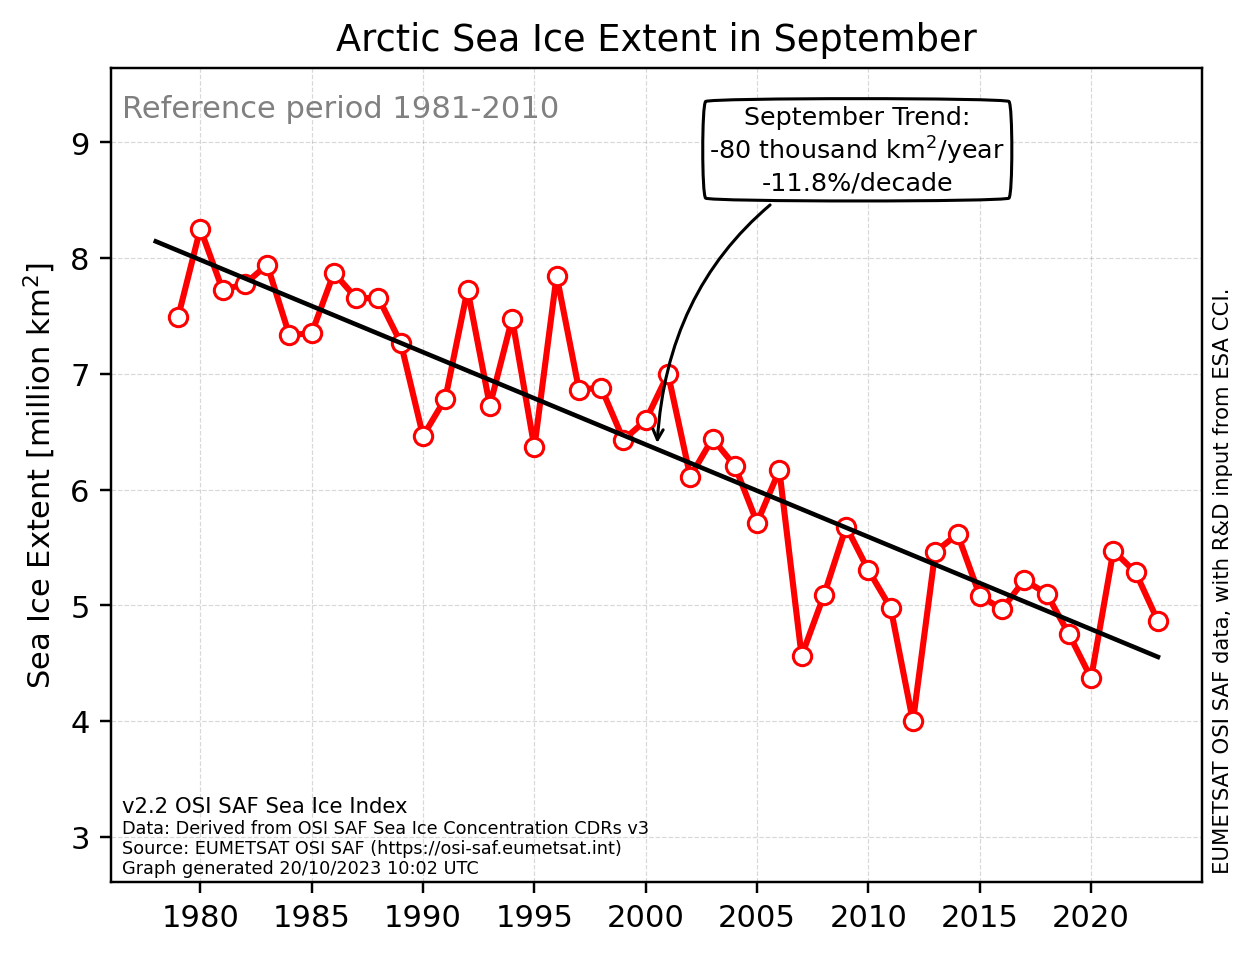
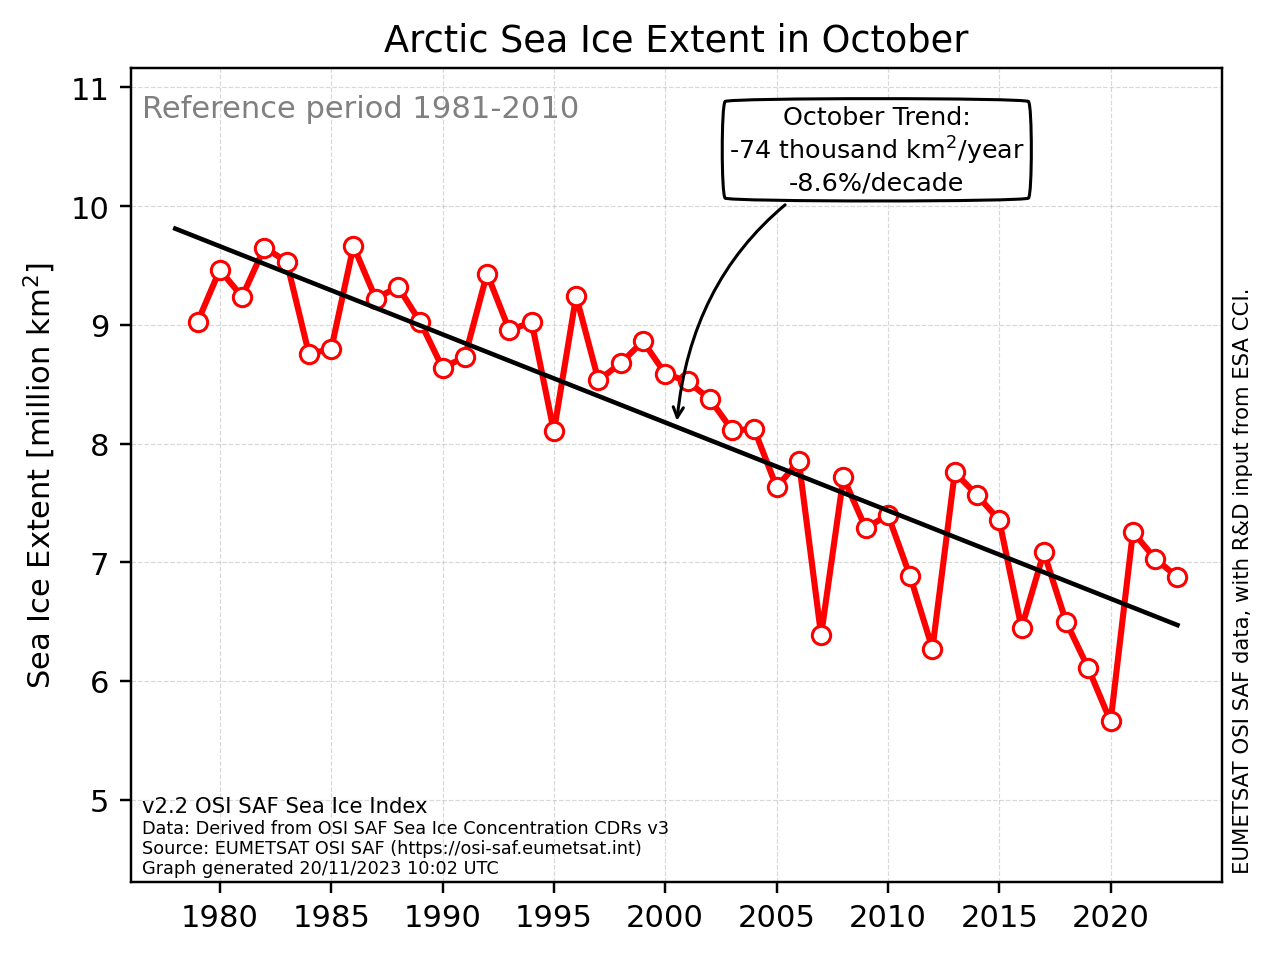
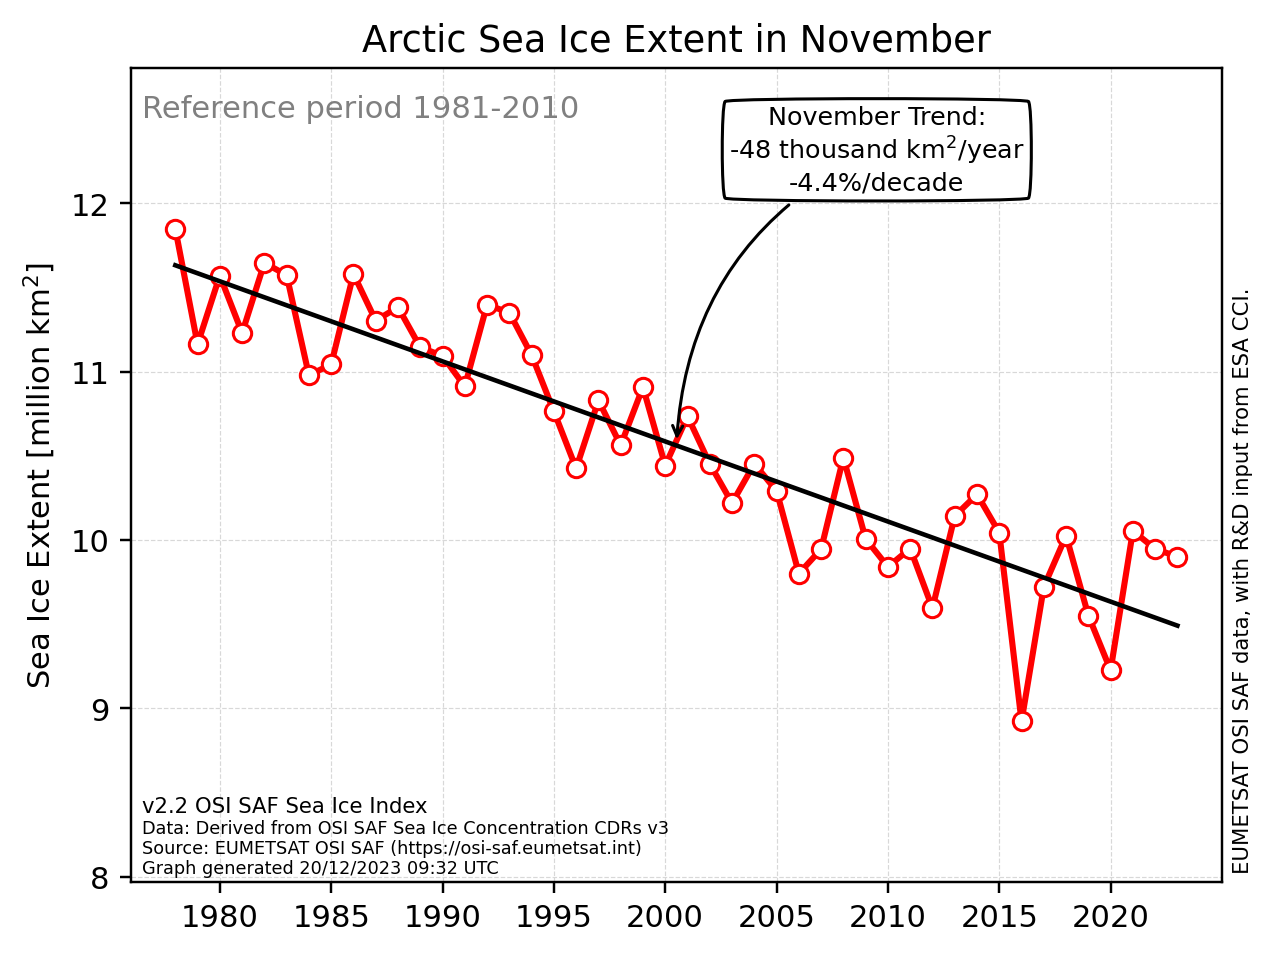
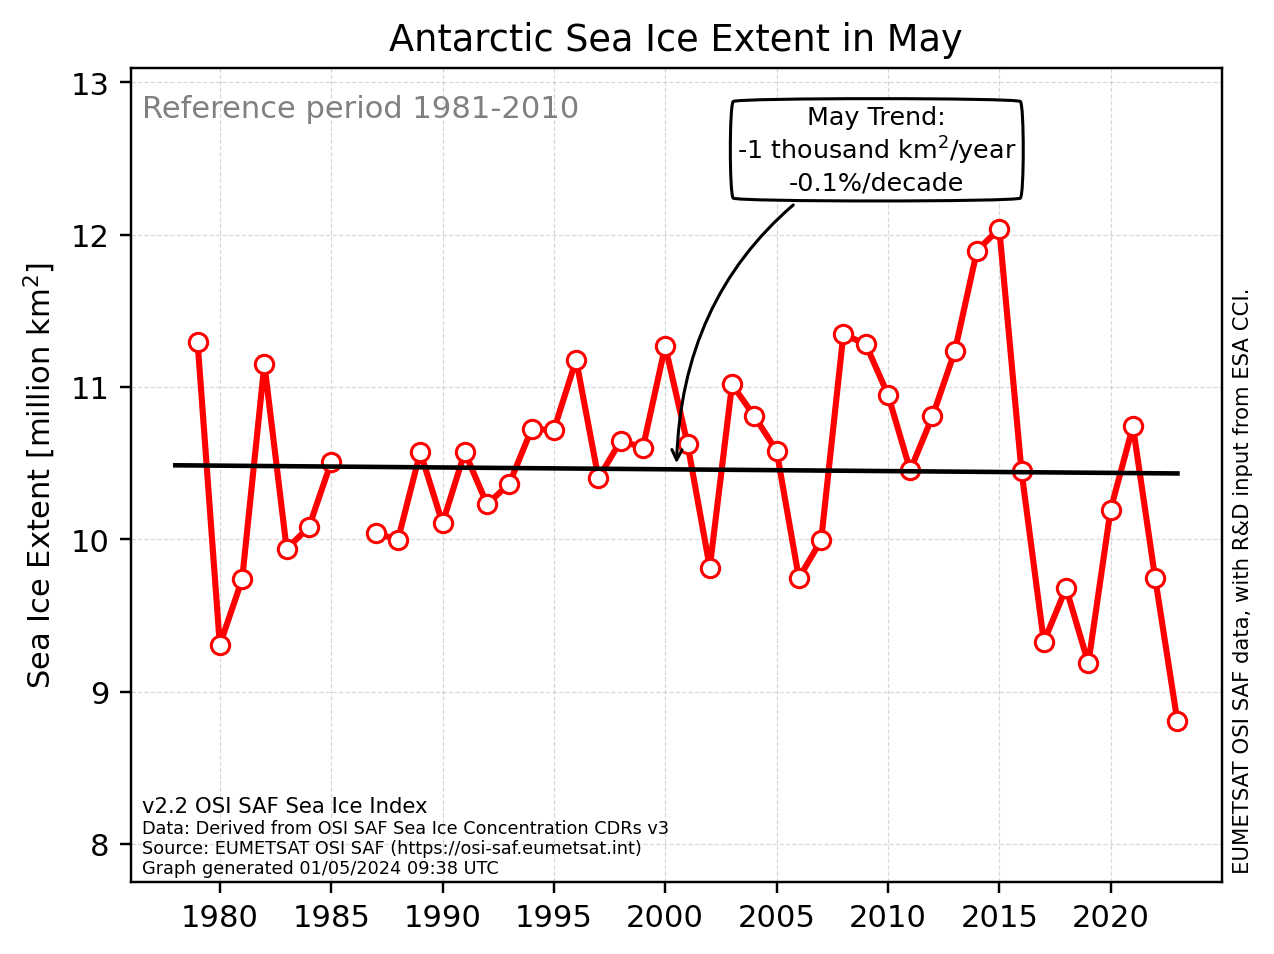
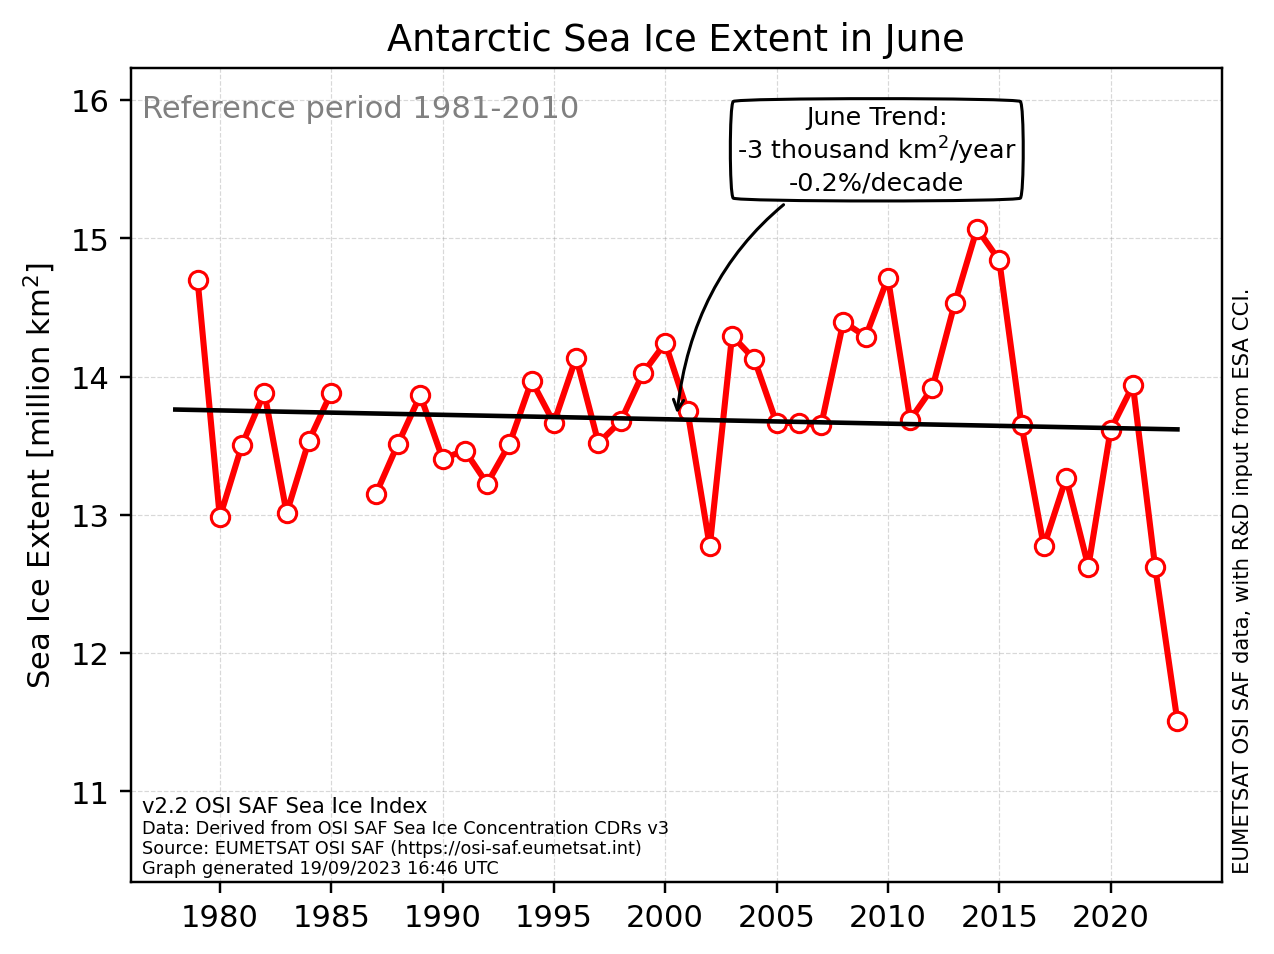
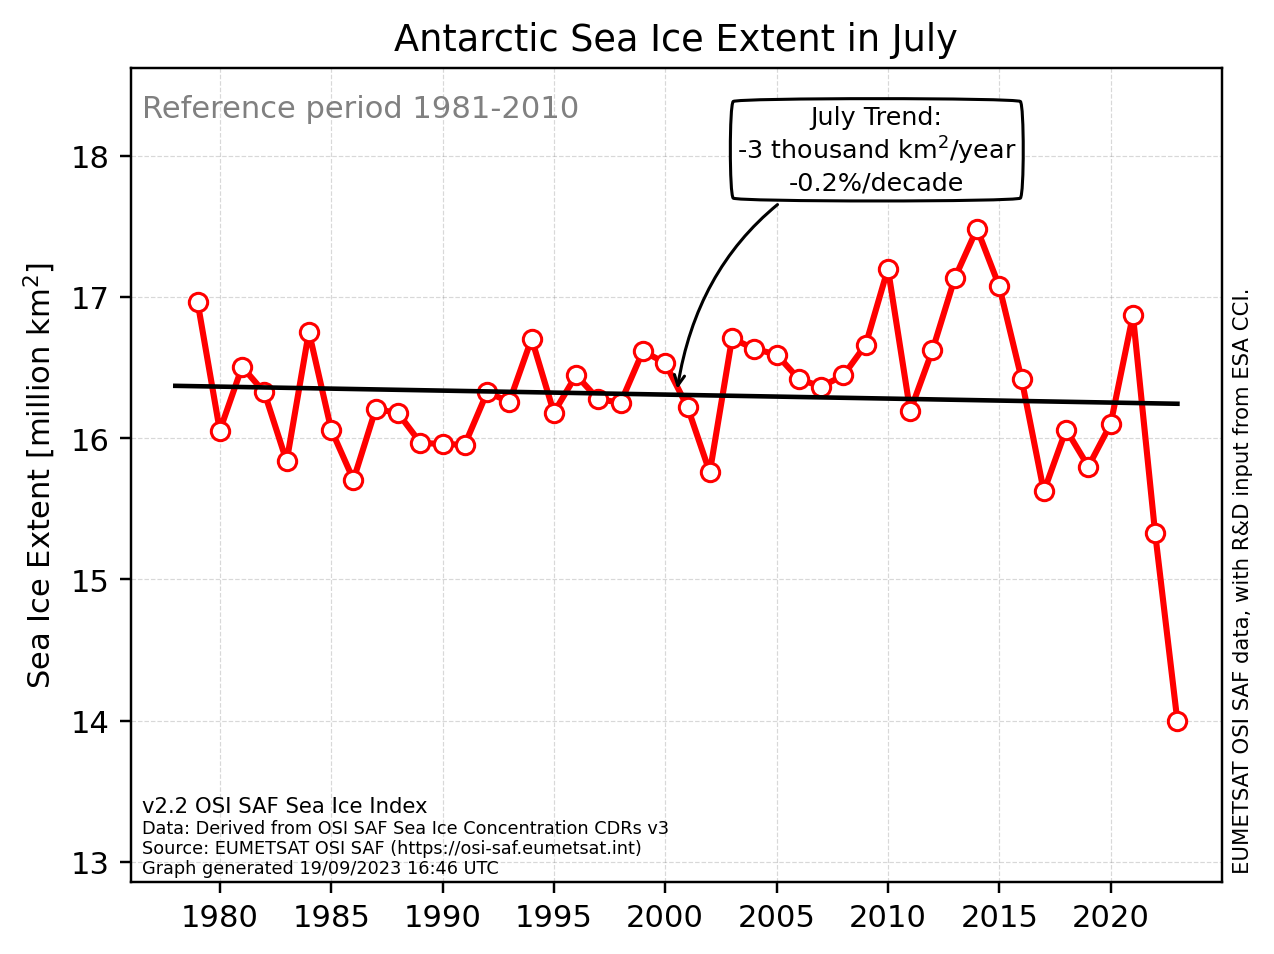
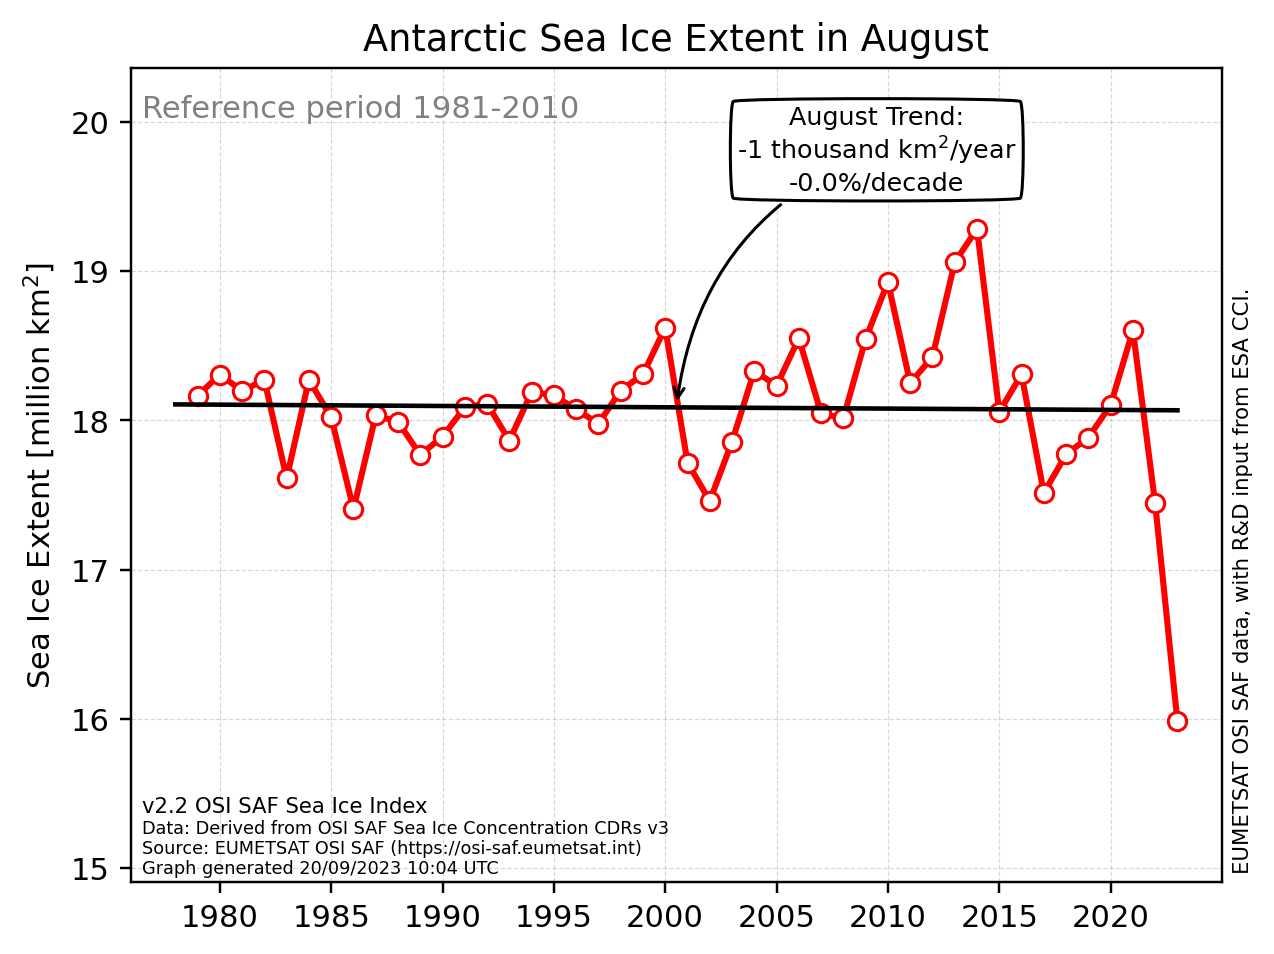
All the trends are from least-square linear regression, with no consideration for statistical correlations between the points along the time series. As for all trends, they describe the past changes, but should be used with caution when predicting future evolution. The linear rate of change in SIE is always indicated as thousands km per year, to be easily comparable with the values at the NSIDC SII.
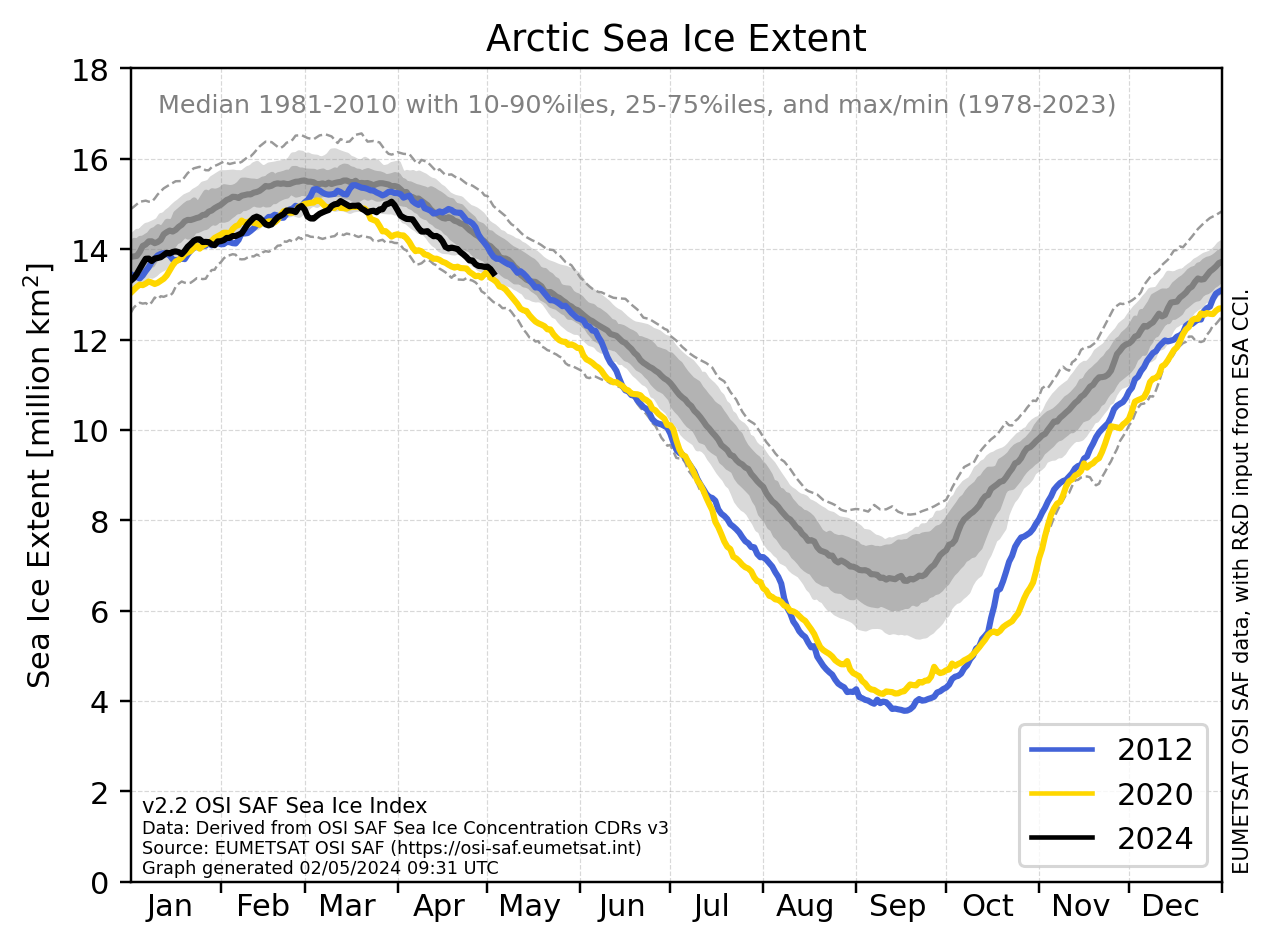
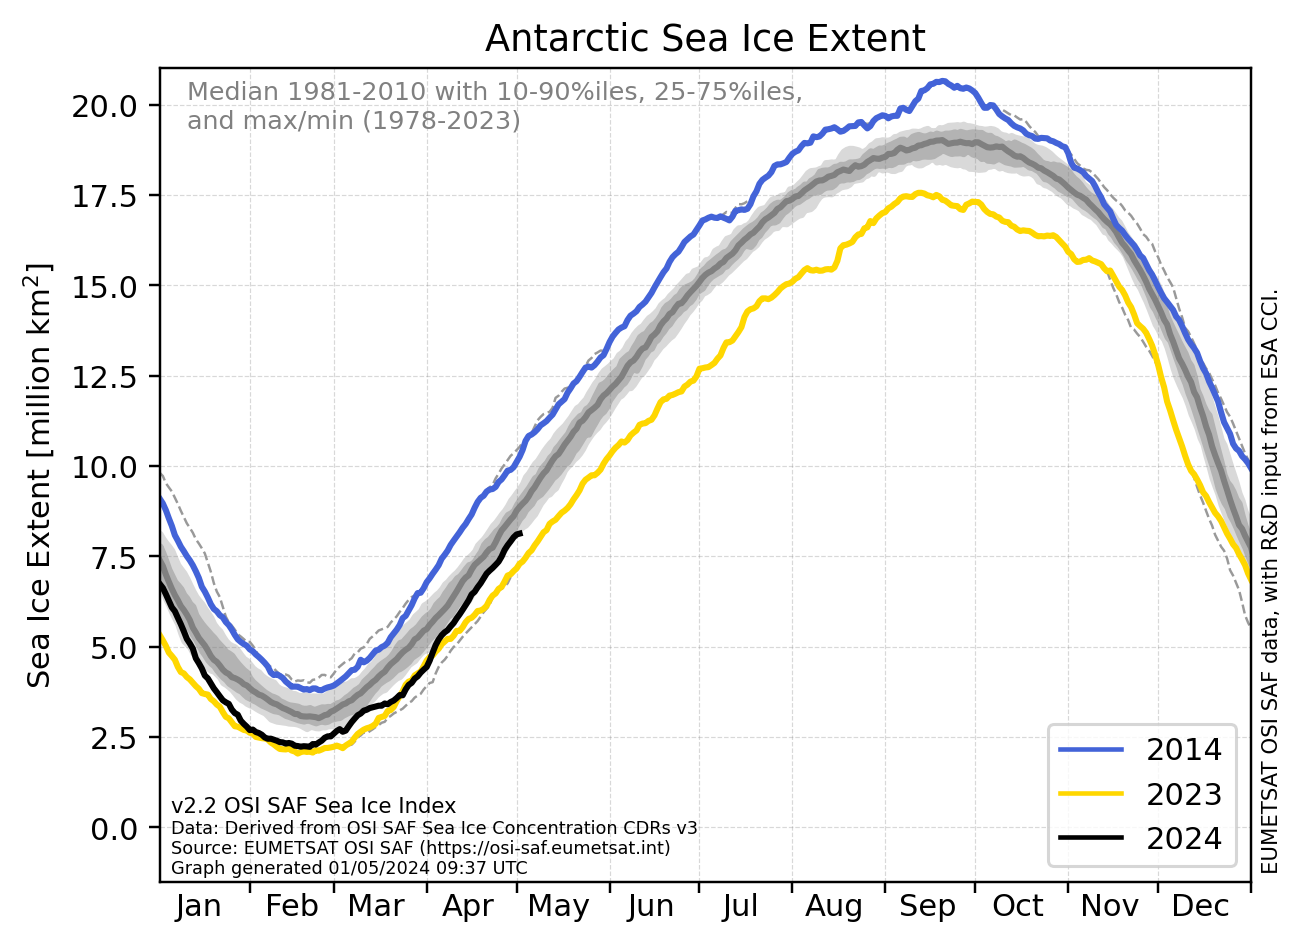
The same rate of change are also reported as percentage change per decade, relative to a base period. The base period is 1981-2010.
Difference to older version
An earlier version of these graphs (v2.1) is available until end of August 2023. The main difference with between v2.2 and v2.1 is that:
- v2.2 uses the v3 of the OSI SAF sea ice concentration CDR and ICDR
- v2.1 uses the v2 of the OSI SAF sea ice concentration CDR and ICDR