Sea Ice Concentration, Edge and Type product validation and monitoring
The OSI SAF sea ice concentration and edge products are continuously compared with navigational ice charts. At present these charts are the best independent source for routine validation. The ice charts are based on a variety of satellite data sources, primarily Synthetic Aperture Radar (SAR) and optical. A detailed interpretation of satellite imagery and a subsequent mapping procedure are carried out by skilled (experienced and trained) ice analysts. The ice charts are primarily used for strategic and tactical planning within the offshore and shipping community. Requirements are strict; demands are for detailed high quality products for several areas. The validation is done using the operational ice charts for the Svalbard region and Weddell Sea from the MET Norway Ice Service, and the Northern and Southern Hemisphere from the U. S. National Ice Center (NIC).
The sea ice type quality assessment is done as a monitoring of the monthly variation of the multi year ice area coverage, as presented in the table below.
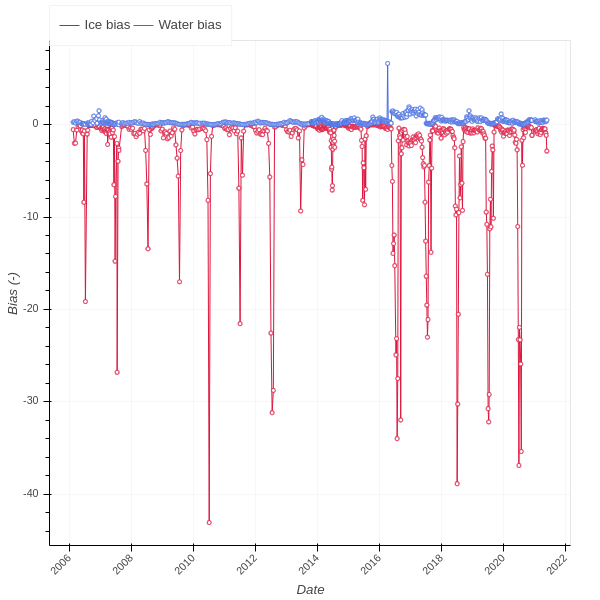
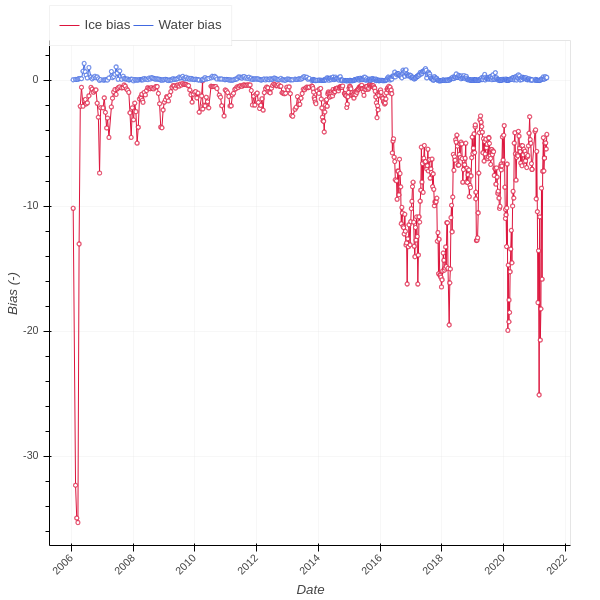
Sea ice concentration OSI-401-d comparison with NIC Northern Hemisphere ice charts:
Ice concentration mean difference
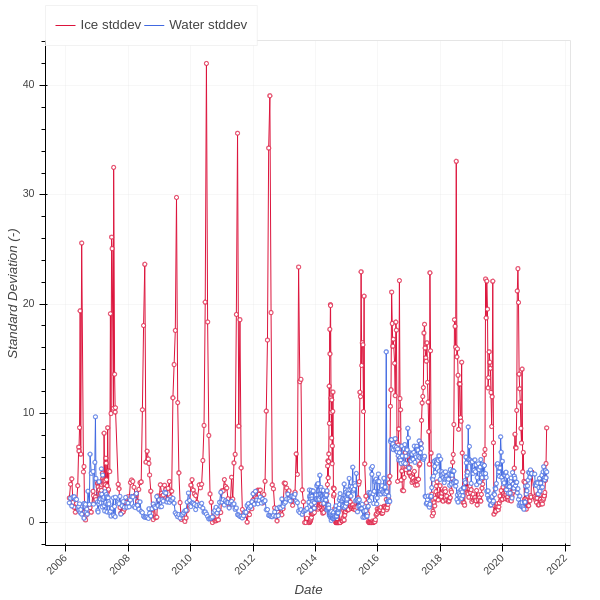
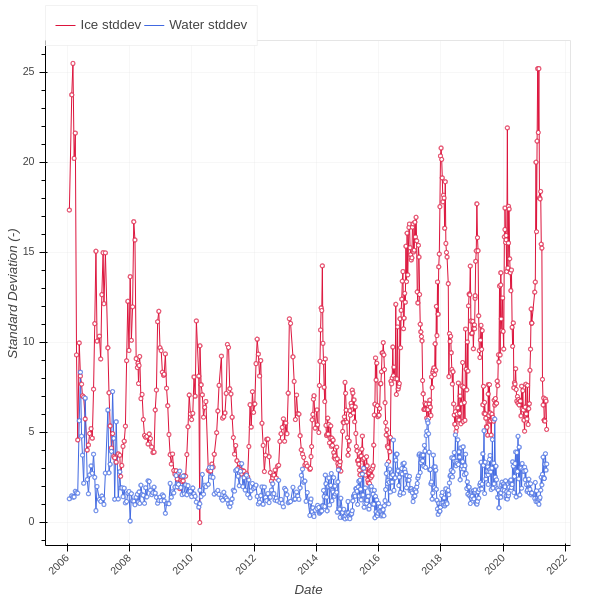
Ice concentration standard deviation
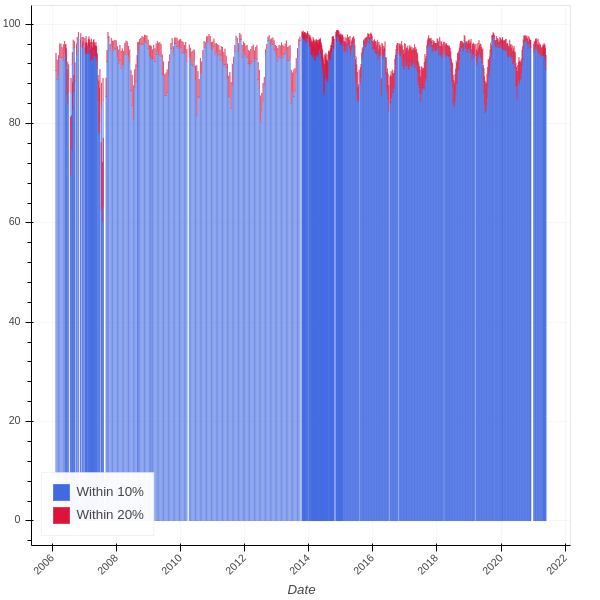
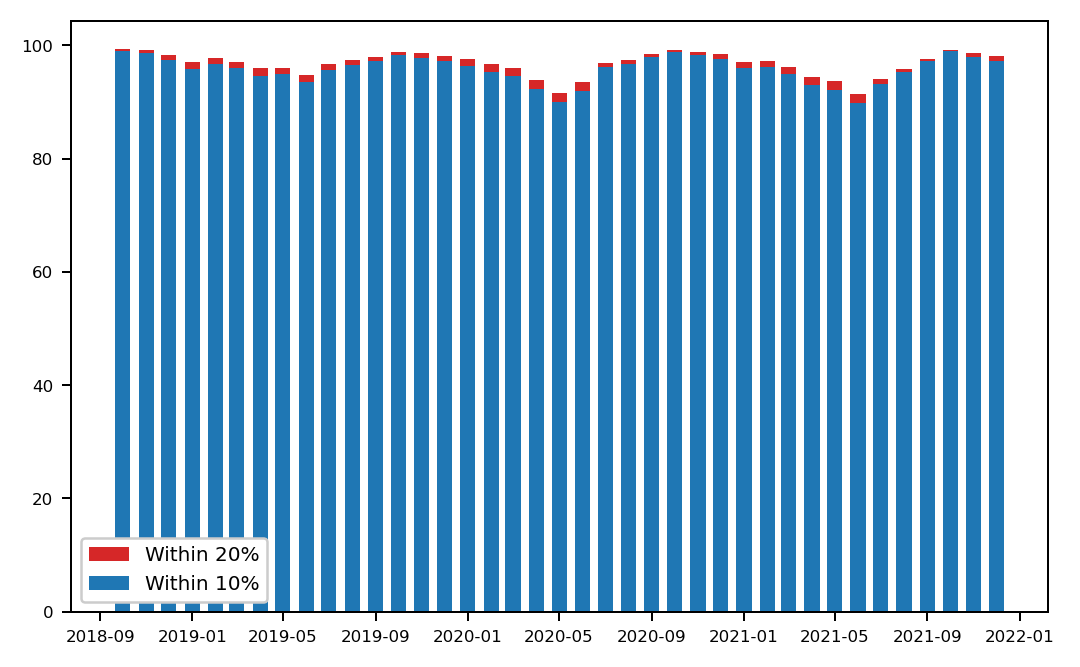
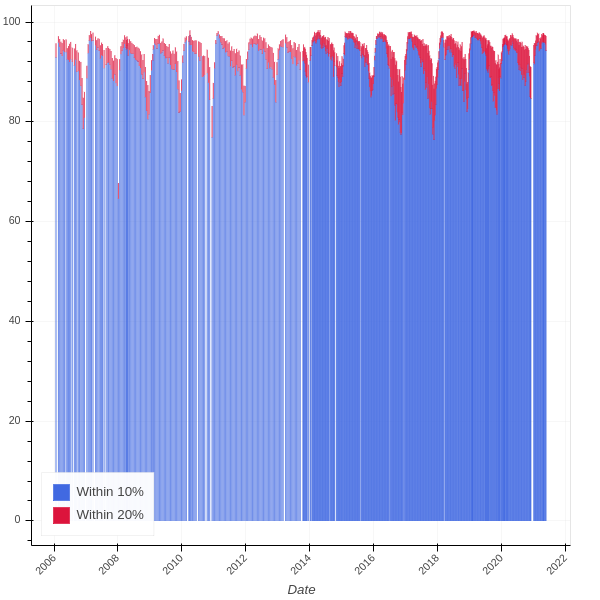
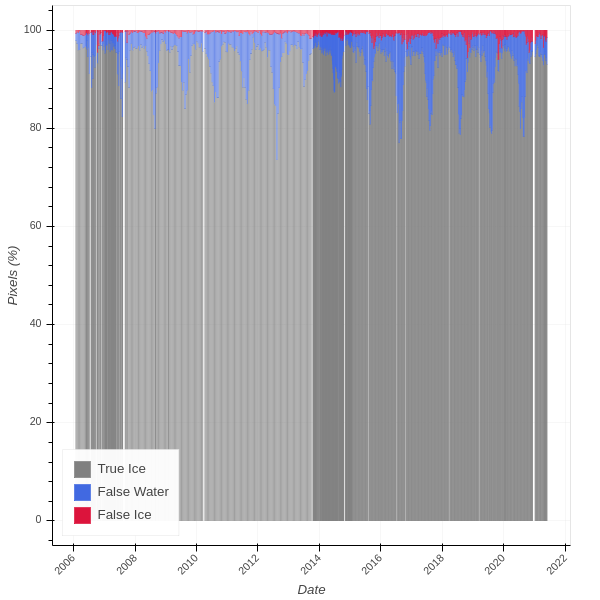
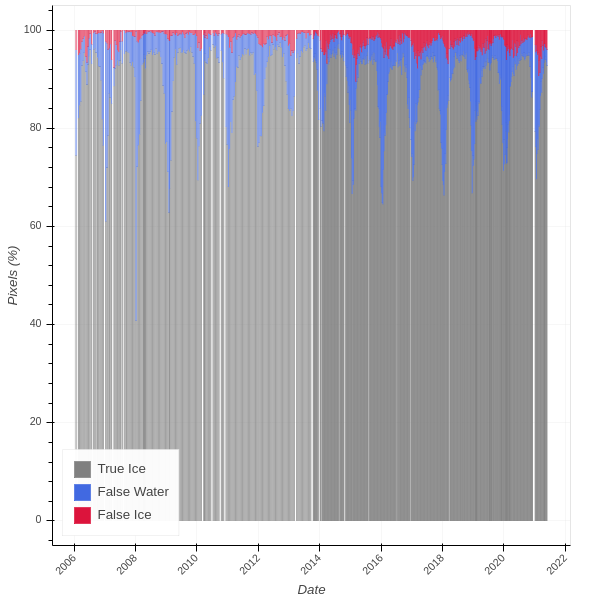
Ice concentration bar plot
Sea ice concentration OSI-401-d comparison with MET Norway Svalbard ice charts:
Ice concentration mean difference
Ice concentration standard deviation
Ice concentration bar plot
Sea ice concentration OSI-401-d comparison with NIC Southern Hemisphere ice charts:
Ice concentration mean difference
Ice concentration standard deviation
Ice concentration bar plot
Sea ice concentration OSI-401-d comparison with MET Norway Weddell Sea ice charts:
Ice concentration mean difference
Ice concentration standard deviation
Ice concentration bar plot
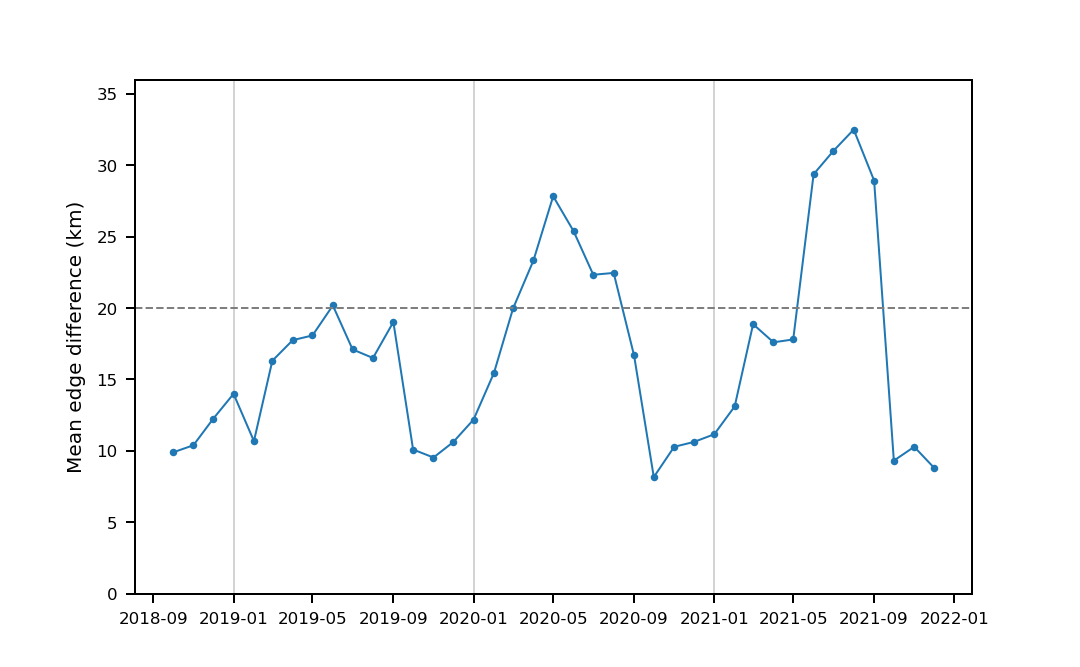
Sea ice edge OSI-402-d comparison with MET Norway Svalbard ice charts around:
Distance to ice edge
Matching ice edge area comparison
Sea ice edge OSI-402-d comparison with MET Norway Weddell Sea ice charts:
Distance to ice edge
Matching ice edge area comparison
Sea ice edge OSI-402-d comparison with NIC ice charts:
Matching ice edge area comparison Northern Hemisphere
Matching ice edge area comparison Southern Hemisphere
Sea ice type OSI-403-d monitoring:
Northern Hemisphere product
Southern Hemisphere product
Sea ice concentration OSI-408-a comparison with NIC Northern Hemisphere ice charts:
Ice concentration mean difference
Ice concentration standard deviation
Ice concentration bar plot
Sea ice concentration OSI-408-a comparison with NIC Southern Hemisphere ice charts:
Ice concentration mean difference
Ice concentration standard deviation
Ice concentration bar plot
More details from our regular validation are available in the Half Yearly Reports from OSI SAF, available at https://osi-saf.eumetsat.int/documentation/project-documentation
The image below shows an example of a high resolution ice chart from the Ice Service around Svalbard from 07.10.2019.
