Atlantic High Latitude Downward Longwave Irradiance
Introduction

The high latitude radiative flux products developed at the Norwegian Meteorological Institute contains shortwave (SSI) and longwave (DLI) irradiance received at the surface. The Ocean and sea Ice SAF radiative flux products are currently produced at 5 and 10 km spatial resolution once daily. Input data are AVHRR data from both NOAA POES and Eumetsat Polar System (EPS). Although each satellite passage is processed, the official radiative flux products from the EUMETSAT OSISAF are daily products which represents the mean daily irradiance received at the surface in Watt per square meter.
This page describes the DLI product.
Information in brief
| Type | Downward Longwave Irradiance (DLI) |
| Input data | AVHRR |
| Auxiliary data | Climatological maps of albedo Climatological maps of ozone NWP humidity simulations |
| Resolution | 5 kilometer |
| Frequency | Daily |
| File formats | WMO Grib NCSA HDF5 |
| Dissemination channels | FTP server EUMETCAST WMO GTS (upon request from a user community) |
| Documentation | Product manual |
| Contact email | osisaf-manager[at]met.no |
Status
Daily quicklook products are available here. WMO GRIB and HDF5 files including quality flag etc are available for FTP download. Work is ongoing to deliver data in NetCDF/CF.
Details
The processing of OSISAF HL radiative flux products are based upon processing the AVHRR data to Level 2 and predefined product areas by the EUMETSAT NWPSAF software package AAPP in combination with Meteo France/CMS software ANA and EUMETSAT NWCSAF software AHAMAP. The predefined product areas are also output from the NWCSAF PPS cloudmask/cloudtype processing. Whenever a new satellite passage is received, the NWCSAF PPS cloudtype is generated and OSISAF HL Flux processing is initiated.
All auxiliary data needed in the processing are remapped to these predefined areas which also are the high resolution products (1.5km nominal horizontal resolution) generated by the OSISAF HL FLUX processing. These product areas are, for each satellite passage, resampled onto 5 and 10km OSISAF HL grids (Polar stereographic, correct at 60°N, aligned along the Greenwich meridian. In the resampling only pixels with a confidence level of equal or better than bad are used.
The same procedure is used when the individual satellite passages at the OSISAF HL grid are averaged to get a daily estimate. Due to the poor coverage in time, no 3 hourly product is generated of the OSISAF HL Flux processing.
The algorithm is the same as the algorithm used by Meteo France/CMS for GOES/MSG data. It is essentially a hybrid method combining a bulk parameterization for the clear sky contribution and satellite derived cloud information according to the formula:
DLI = (e0 + (1 - e0) C )*S*Ta^4
where
e0: clear sky emissivity, Prata's formulation + predicted surface air temperature and humidity (NWP model)
S: Stefan-Boltzmann constant
C: infrared cloud amount which is estimated as
during daytime: C = 1 - SSI / SSIclear
SSI, SSIclear surface solar irradiance and clear sky surface solar irradiance.
during nighttime: C = ni Ci
ni: the fractional sky cover by cloud type i. For the AVHRR data this is normally either clear, overcast or contaminated.
Ci: contribution coefficient of this cloud type. The cloud types correspond to a simplified classification deduced from the detailed NWCSAF PPS cloudtype classification (by merging some types). The Ci coefficients have been adjusted on a learning file with pyrgeometer measurements and observed air temperature and humidity.
The OSISAF HL algorithm is of course adapted and tuned to the input of AVHRR data and the NWCSAF PPS output.
AVHRR data both from NOAA and EUMETSAT satellites are used in the processing.
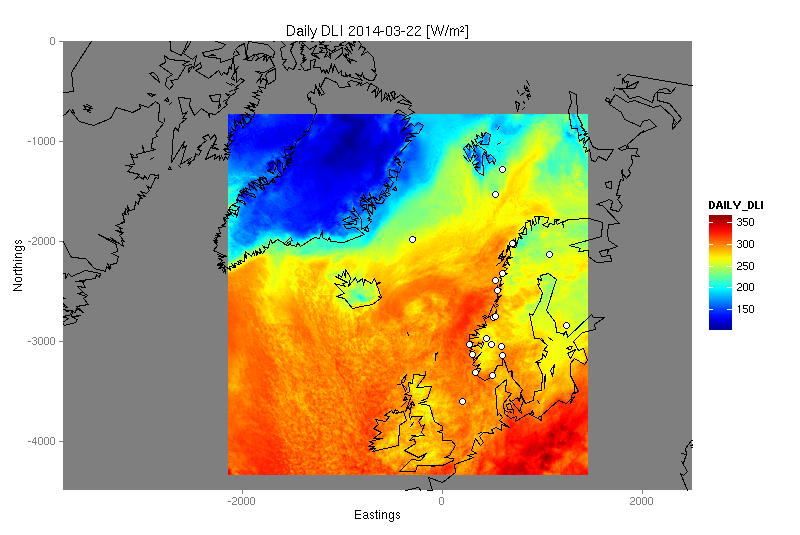
A sample product is provided below. The white dots in the image represents potential validation stations. All of these observe shortwave incoming irradiance, but not all observe longwave incoming irradiance.
SSI and DLI validation
The estimates based on remote sensing data are routinely validated against available in situ measurements. Much effort has been dedicated to validation and gaining access to relevant validation data in recent years. In the map below validation stations where data are available for usage in the OSISAF validation scheme are indicated.
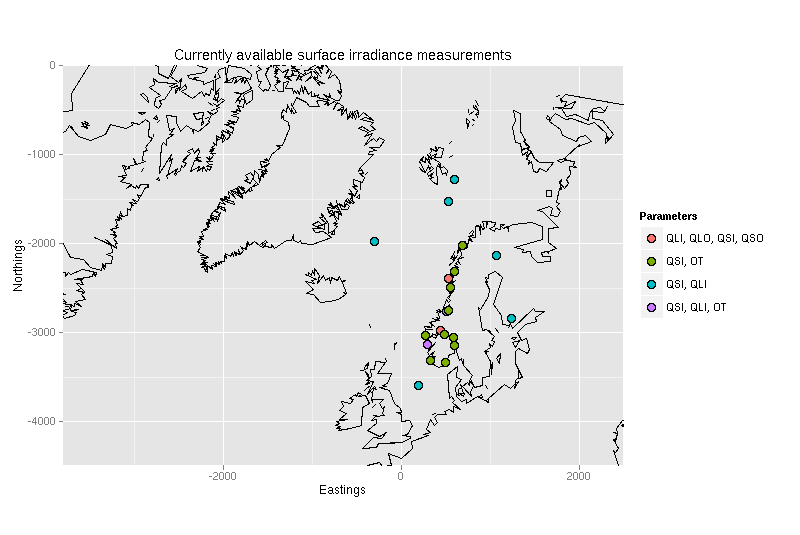
In the illustration provided, the following keywords are used:
| Keyword | Meaning |
|---|---|
| QLI | Incoming longwave irradiance at the surface |
| QLO | Outgoing longwave irradiance at the surface |
| QSI | Incoming shortwave irradiance at the surface |
| QSO | Outgoing shortwave irradiance at the surface |
| OT | Sunshine duration (normally when global irradiance exceeds 120 W/m²) |
Example of validation results, covering a period of 6 months in 2013/2014, is presented below. Not all stations listed in the map above is used. For some of the stations, extensive shadow effects cause problems validating SSI, work is ongoing to create adjustment factors for these. The illustration presented here is the relative bias error of the product. The left panel shows validation results for SSI and the right panel for DLI. This ilustration is a merged version of the validation results for several validation periods.
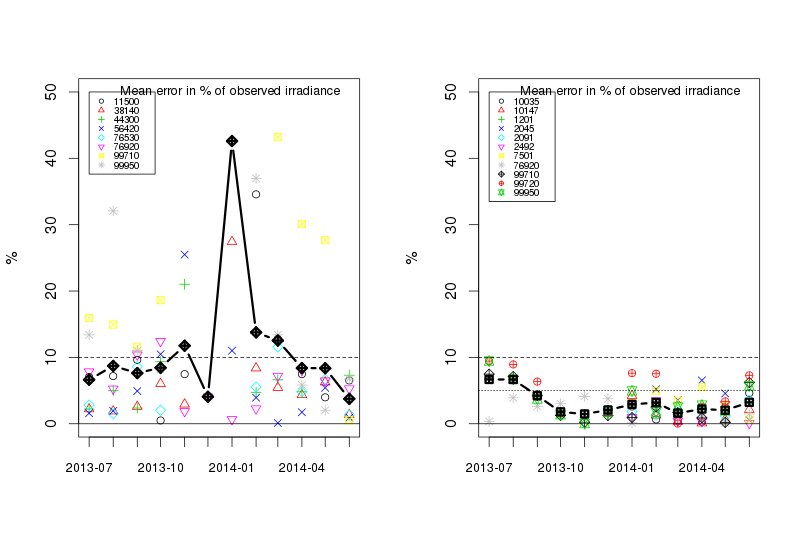
Typically the quality of the SSI products is poorer during winter than during summer due to the snow covered ground at high latitudes. Maintenance of the in situ equipment may also affect results, but usually stations affected by such issues are removed from the validation until they are working properly again (this is why the stations used may differ between validation periods). The quality of DLI is usually slightly poorer during summer than during winter due to more scattered cloud cover.