Validation around Svalbard
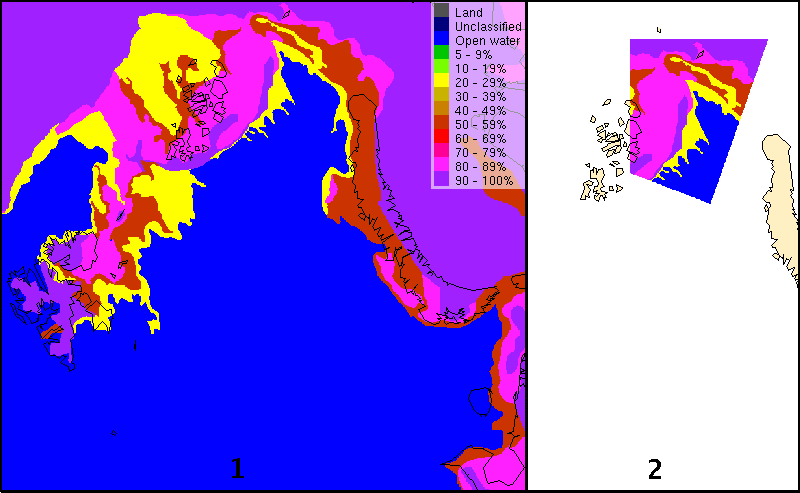
The Sea Ice service at met.no produce daily ice charts covering the Fram Strait to the Barents Sea with main emphasize on the areas around Svalbard. Areas where independent information (manual inspection of SAR, MODIS and AVHRR) are utilized are marked by the ice service. These are then collocated with the OSI SAF ice product. The focus is on areas close to the ice edge. Example of a used area is given in the figure below. To the left (1) a daily Sea Ice service product is show, to the right (2) a polygon with validation data from the same product is shown. Click at the image to enlarge.
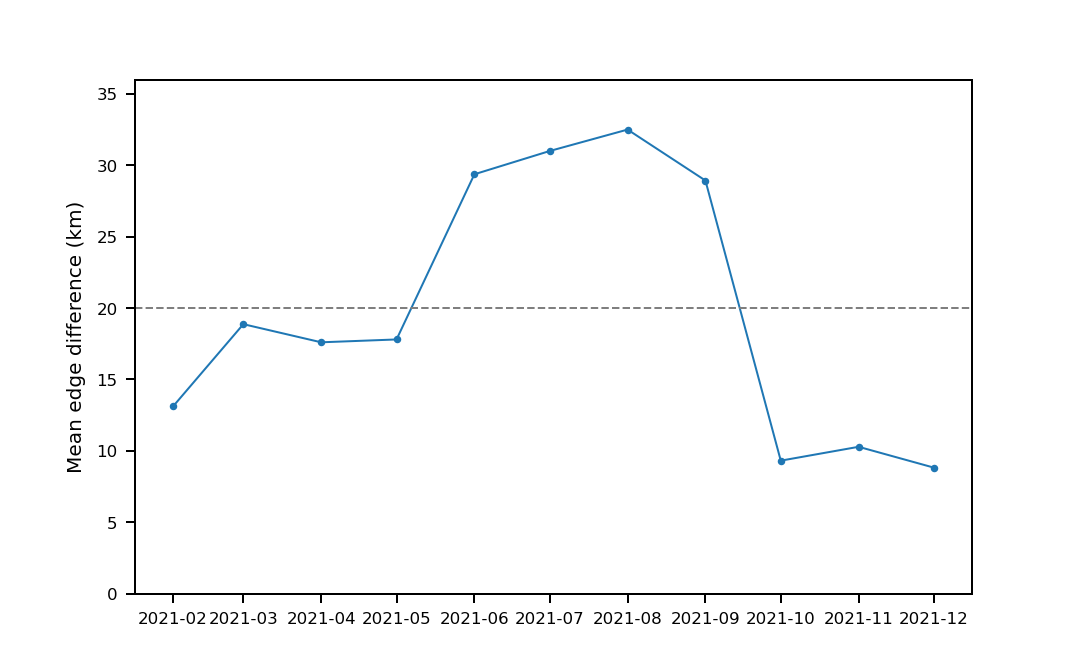
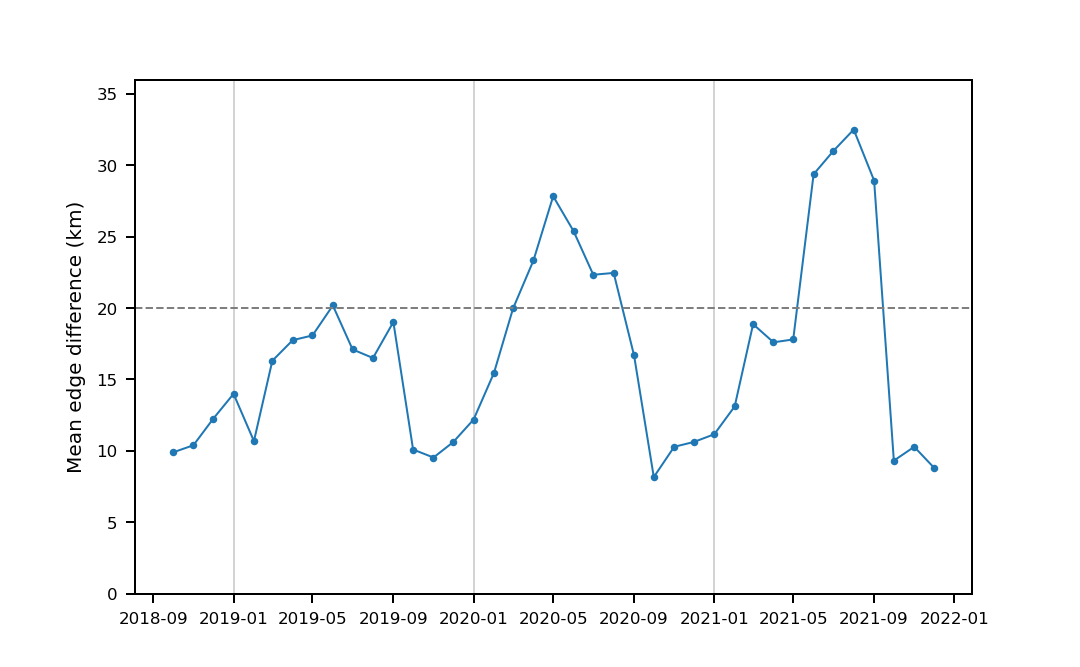
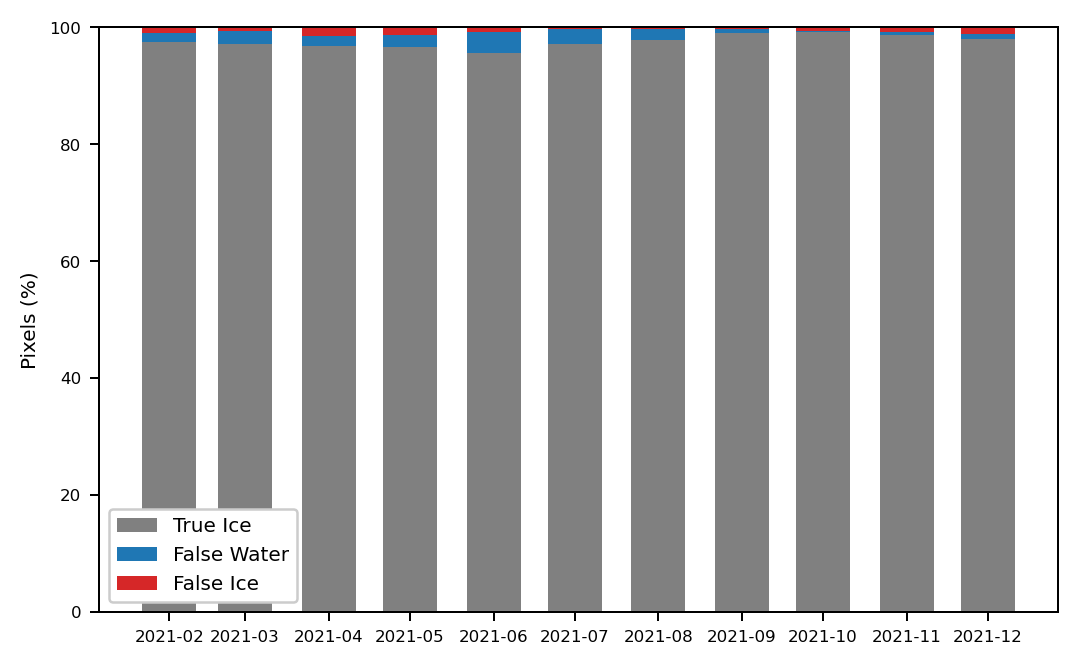
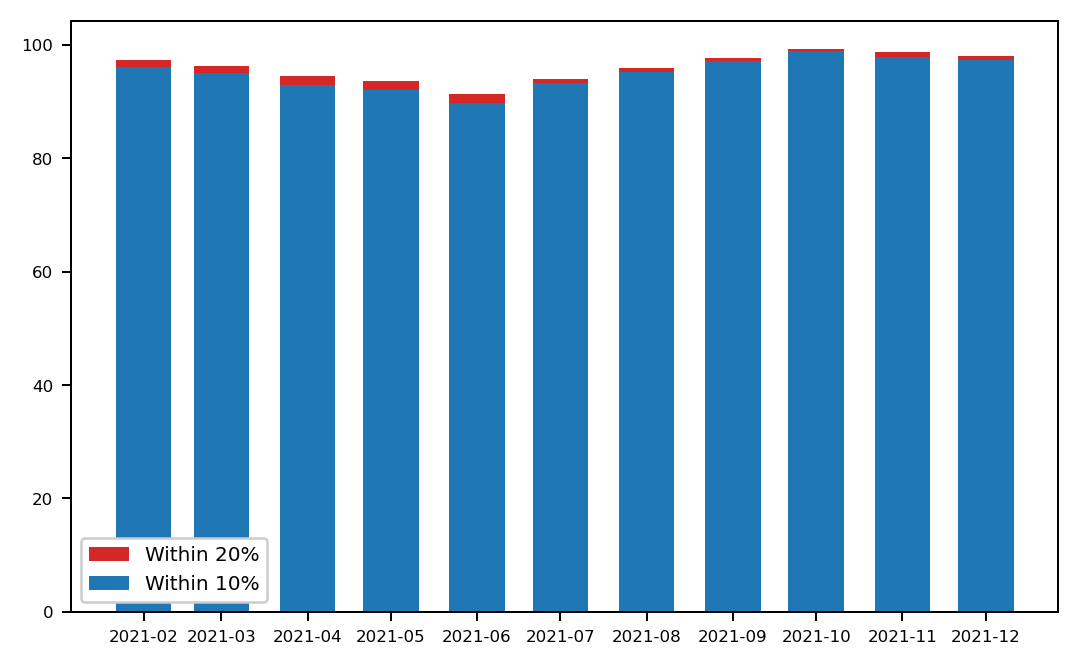
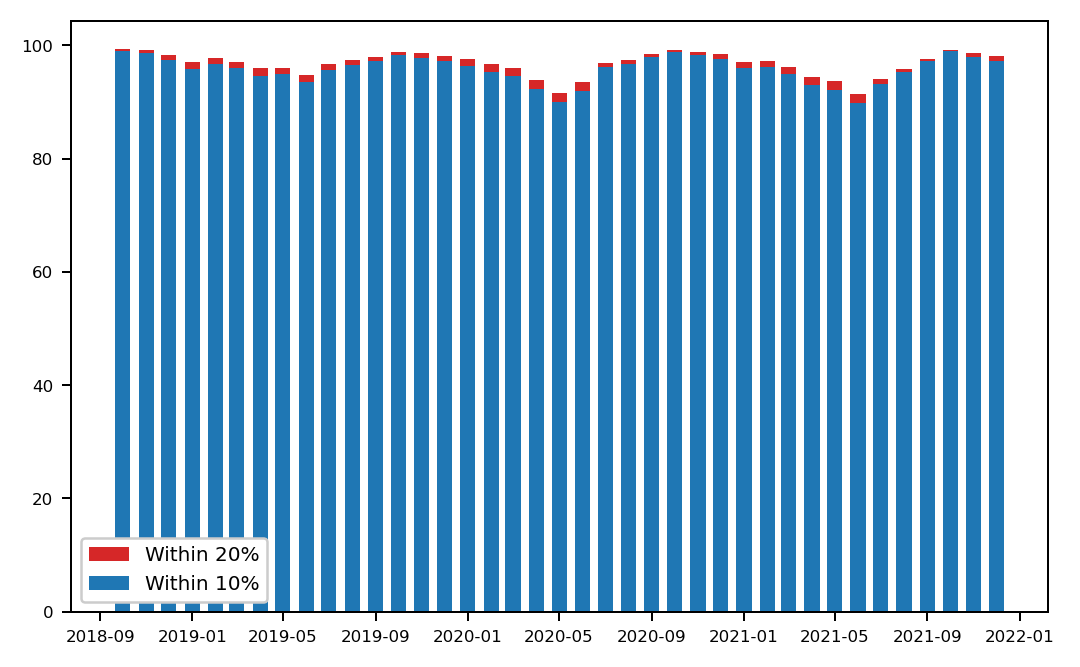
Below figures with results from comparing the OSI SAF ice concentration and ice edge products are given. These validation results are representing areas close to the ice edge. Areas further into the Artic ice have not been included. Including these areas would have increased the validation "score". The validation results show the relative performance in the areas close to the ice edge and for example illustrates the problems finding the ice edge during late summer.
Distance to ice edge comparison last year
Distance to ice edge comparison 2018-today
Matching area comparison last year
Matching area comparison 2018-today
Ice concentration comparison last year
Ice concentration comparison 2018-today