Validation against NIC ice charts at Southern Hemisphere
The statistics presented on this page are based upon ice charts produced at the U. S. National Ice Center (NIC) for the Southern hemisphere. The charts are derived from remotely sensed data and observations. RADARSAT, ENVISAT, DMSP/OLS, NOAA/TIROS, MODIS, QUIKSCAT and DMSP/SSM-I sensors comprise the majority of the sensors used in the analysis. The purpose of producing the charts is to provide sea and lake ice data in support of naval operations, homeland security, scientific research and polar region climatology. The charts contain information pertaining to the concentration, stages of development (a proxy based on theoretical thickness and actual thickness measurements when available), forms of the ice, and other information relating to the World Meteorological Organization (WMO) codes for the reporting of sea ice. SIGRID-3 values are validated for consistency with WMO standards for reporting ice conditions. The chart is manually quality controlled.
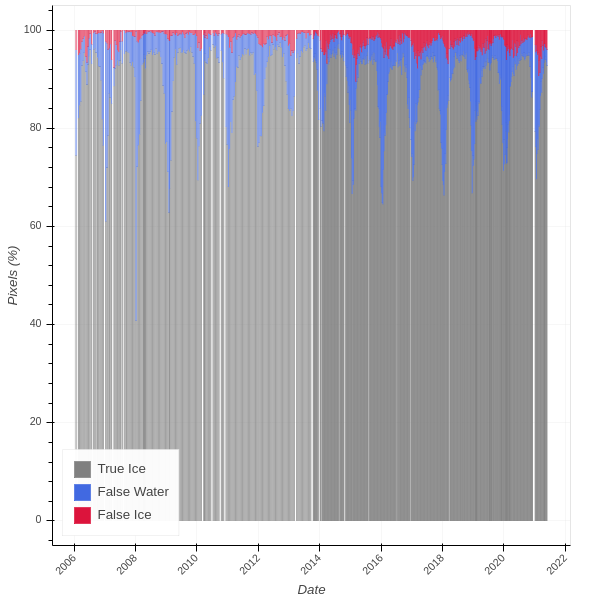
For the derivation of the statistics presented at this page only the total sea ice concentration from the ice chart has been used.
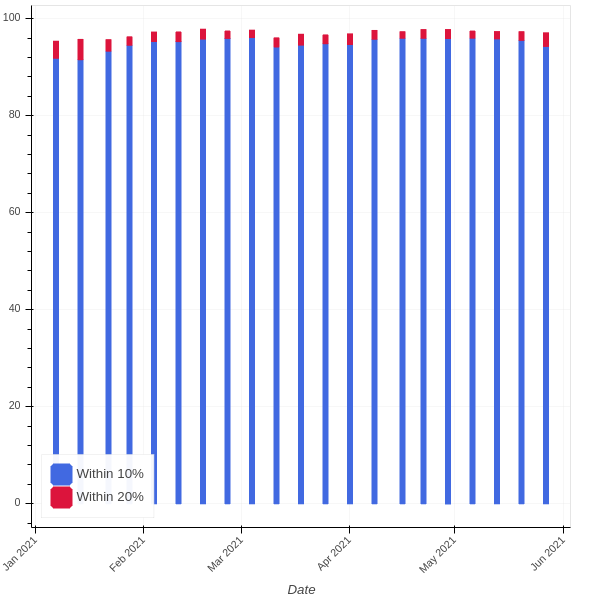
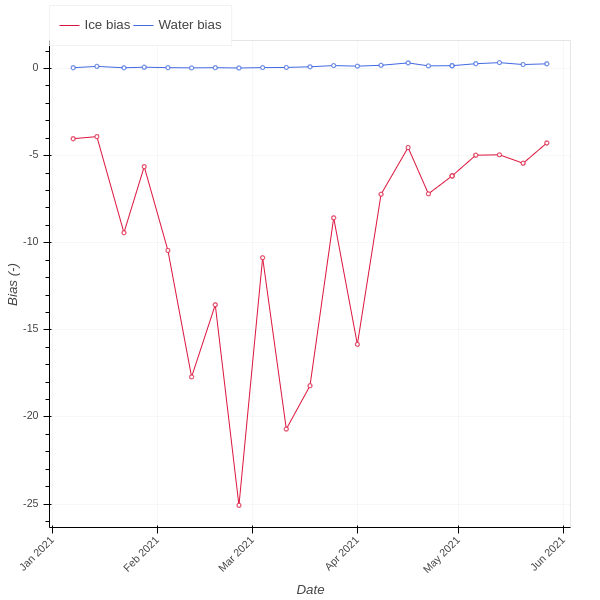
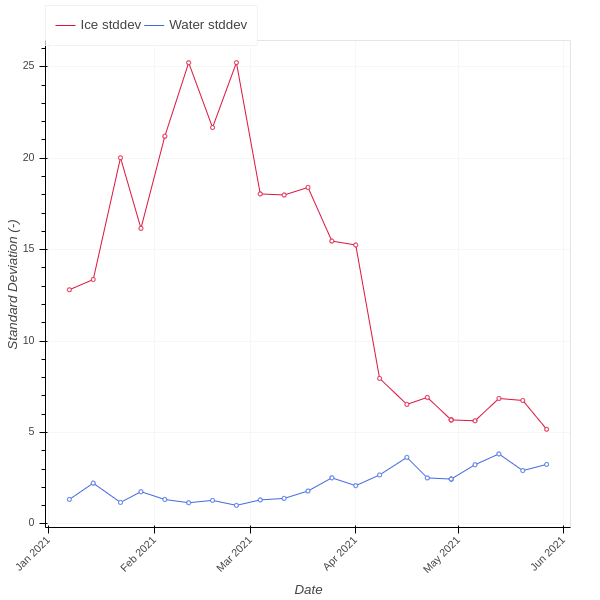
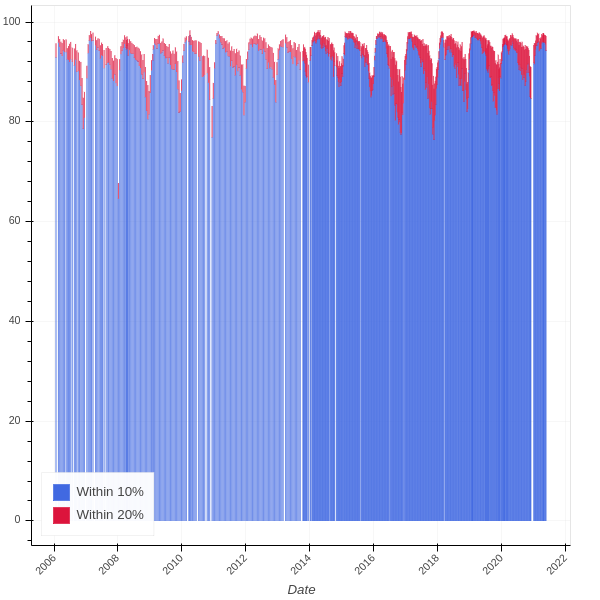
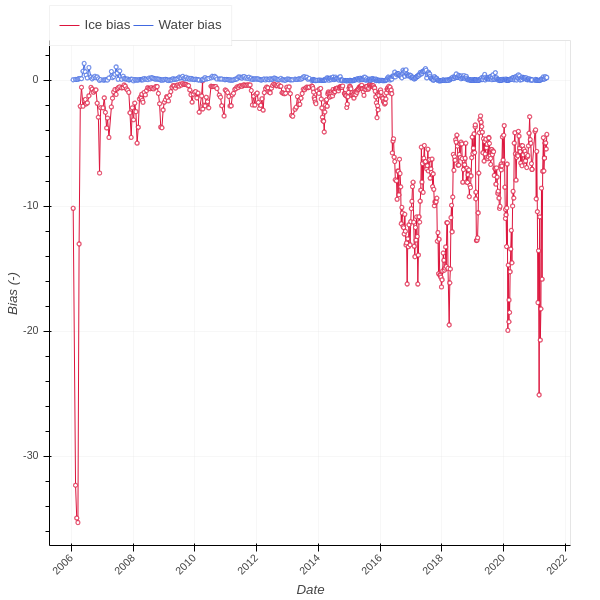
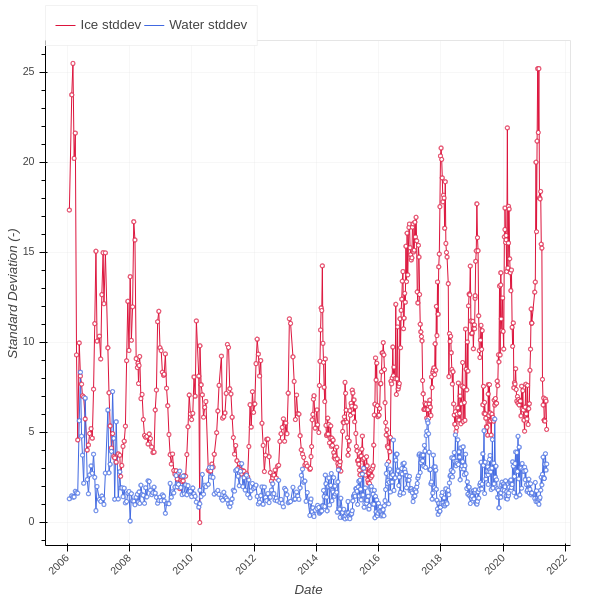
The validation is carried out as a twice monthly validation by means of automatic comparison of OSI SAF grid with ice chart information. The ice chart (available every two weeks) and the OSI SAF product are gridded into a common projection and resolution. Following this a cell by cell comparison is carried out. For each ice concentration level in the ice chart, the deviation between ice chart concentration and OSI SAF ice concentration is calculated. Afterwards deviations are grouped into categories, i.e. +/-10% and +/-20%. Furthermore the bias and standard deviation is calculated for each concentration level. The bias and standard deviation are reported for ice (> 0% ice concentration), for water (0% ice concentration) and for both ice and water as a total.
For the weekly validation the concentration product is required to have a bias and standard deviation less than 15 % ice concentration for the southern hemisphere on an annual basis.
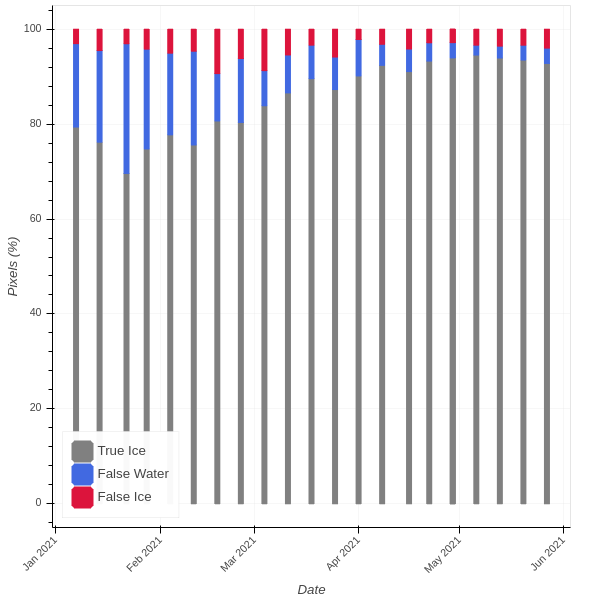
Ice edge comparison last year
Ice concentration comparison last year
Ice concentration bias last year
Ice concentration standard deviation last year
Ice edge comparison 2006 - today
Ice concentration comparison 2006 - today
Ice concentration bias 2006 - today
Ice concentration stddev 2006 - today